UTRASONOGRAPHY (SONO)
- Previous chapter: 6.1.2 Electron microscopy
Ultrasound are simply sound waves, just like audible sound. Although some physical properties depend on the frequency, the basic principles are the same. Sound consists of waves of compression and decompression of the transmitting medium (e.g. air or water), traveling at a fixed velocity. Sound is an example of a longitudinal wave oscillating back and forth in the direction in which the sound wave travels, thus consisting of successive zones of compression and rarefaction. Transverse waves are oscillations in the transverse direction of the propagation. (For instance surface waves on water or electromagnetic radiation.)
The audible sound frequencies are below 15 000 to 20 000 Hz, while
diagnostic ultrasound is in the range of 1 - 12 MHz. Audible sound travels
around corners, therefore we can hear sounds around a corner (sound
diffraction). With higher frequencies the sound tends to move more in straight
lines like electromagnetic beams, and will be reflected like light beams. They
will be reflected by much smaller objects (because of shorter wavelengths), and
do not propagate easily in gaseous media. The wavelength λ is
inversely related to the frequency f by the sound velocity c:
The sound velocity in a given material is constant (at a given temperature), but varies in different materials:
|
Material |
Velocity ( m/s) |
|
Air |
330 |
|
Water |
1497 |
|
Metal |
3000 - 6000 |
|
Fat |
1440 |
|
Blood |
1570 |
|
Soft tissue |
1540 |
Tab1: Wave velocity in different tissues
Ultrasound is generated by piezoelectric crystals, which vibrate when
compressed and decompressed by an alternating current applied across the
crystal. The same crystals can act as receivers of reflected ultrasound, the
vibrations are induced by the ultrasound pulse.
Imaging by ultrasound[edit | edit source]
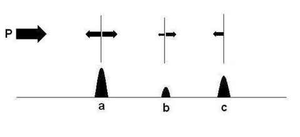
Basically all ultrasound imaging is performed by emitting a pulse, which is partly reflected from a boundary between two tissue structures, and partially transmitted (fig. 2). The reflection depends on the difference in impedance of the two tissues. Basic imaging by ultrasound does only use the amplitude information in the reflected signal. One pulse is emitted, the reflected signal, however, is sampled more or less continuously (actually multiple times). As the velocity of sound in tissue is fairly constant, the time between the emission of a pulse and the reception of a reflected signal is dependent on the distance; i.e. the depth of the reflecting structure. The reflected pulses are thus sampled at multiple time intervals (multiple range gating), corresponding to multiple depths, and are then displayed in the image as depth.
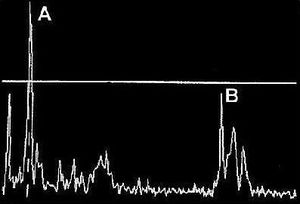
Different structures will reflect a different amount of the emitted energy, and thus the reflected signal from different depths will have different amplitudes as shown below. The time before a new pulse is sent out, is dependent of the maximum desired depth that is desired to be displayed in the image.
The ratio of the amplitude (energy) of the reflected pulse and the incident is called the reflection coefficient. The ratio of the amplitude of the incident pulse and the transmitted pulse is called the transmission coefficient. Both are dependent on the differences in acoustic impedance of the two materials. The acoustic impedance of a medium is the speed of sound in the material times the density ρ:
Z = c.ρ
The reflecting structure does not only reflect directly back to the transmitter, but scatters the ultrasound in more directions. Thus, the reflecting structures are usually termed scatterers.
The time lag between emitting and receiving a pulse is the time it takes for sound to travel the distance to the scatterer and back, i.e. twice the range r, to the scatterer at the speed of sound, c, in the tissue. Thus:
The pulse is thus emitted, and the system is set to await the reflected signals, calculating the depth of the scatterer on the basis of the time from emission to reception of the signal. The total time for awaiting the reflected ultrasound is determined by the preset depth desired in the image.
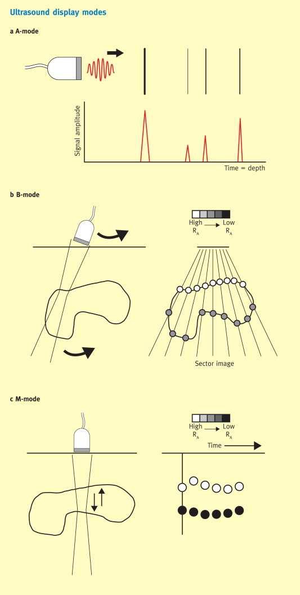
The reflected signals can be displayed in three different modes.
• A-mode: A-mode (amplitude mode) is the simplest type of ultrasound. A single transducer scans a line through the body with the echoes plotted on screen as a function of depth. Therapeutic ultrasound aimed at a specific tumor or calculus is also A-mode, to allow for pinpoint accurate focus of the destructive wave energy.
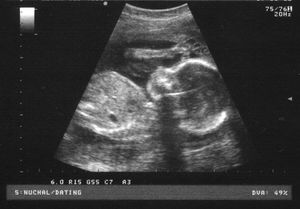
• B-mode or 2D mode: In B-mode (brightness mode) ultrasound, a linear array of transducers simultaneously scans a plane through the body that can be viewed as a two-dimensional image on screen. More commonly known as 2D mode nowadays.
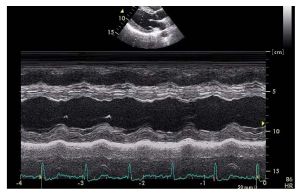
• M-mode: In M-mode (motion mode) ultrasound pulses are emitted in quick succession – each time, either an A-mode or B-mode image is taken. Over time, this is analogous to recording a video in ultrasound. As the organ boundaries that produce reflections move relative to the probe, this can be used to determine the velocity of specific organ structures.
Attenuation[edit | edit source]
It follows that the ultrasound waves are attenuated as some of the energy is reflected or scattered. Thus, in passing through tissue, the energy is attenuated due to the reflection that is necessary to build an image. This is about 10% of the total energy loss. In addition, the ultrasound waves are diffracted, resulting in further diffusion of the waves out into the surrounding tissue and loss in the energy available for reflection (imaging). However, the most important factor is that the ultrasound energy is attenuated due to absorption in the tissue. This absorption process generates heating of the tissue. Thus, the total energy in the ultrasound beam decreases with depth, this is called attenuation. (And the reflections are further attenuated in passing back toward the probe).
Absorption is important for two reasons:
• The heating of the tissue is the safety limitation on ultrasound equipment. The absorbed energy has to remain within limits that do not heat the tissue to dangerous temperatures. The absorption can be calculated, and in commercial equipment today, the limitation is imposed in the limitation of the total energy that can be transmitted (which is expressed by the mechanical index).
• The absorption is the limiting factor for the depth penetration of the beam, i.e. the depth to which the beam can be transmitted.
The absorption is dependent on many factors:
• The density of the tissue. The higher the density, the more absorption. Thus the attenuation is fluid < fat < muscle < fibrous tissue < calcifications and bone.
• The frequency of the ultrasound beam. The higher the frequency, the more absorption. In human tissue, a general approximation is that the attenuation is 1 dB/cm MHz. (however, that is for one way, in imaging the distance is 2* the depth). Thus, the desired depth to be visualized or shown on the image, sets the limit for how high of a frequency (that) can be used. AS can be seen, penetration might be increased by increasing the transmitted energy but this would increase the total absorbed energy as well, which has to stay below the safety limits.
Attenuation can be dealt with by gain, increasing gain amplifies the reflected signal in post processing. However, increased gain increases signal and noise in the same manner. Low amplitude signals can be filtered away, resulting in filtering out cavity noise, however at the price of risking to loose low amplitude signals (e.g. from valves.) by the reject function. Finally, the grey scale can be compressed, resulting in a steeper saturation curve. This means that the picture goes to full saturation (pure white) at a lower amplitude, while the brightness of low amplitude signals are reduced.
All commercial equipment today has a time gain compensation (TGC), increasing the gain of the reflected signals with increasing time from the transmitted pulse. This is equivalent to increasing the gain with increasing depth. However, this is not a perfect solution, as the noise is constant with depth, while the reflected signals become weaker, and with TGC, the noise will be gained as well as the signal, and the signal-to-noise ratio will decrease, thus the resulting signal will end up as a grey blur at a certain depth. This effect can be seen below. Before harmonic imaging, the TGC was adjustable, relying on the operator to optimize the visibility. AS the greater part of cavity noise is removed by the harmonic imaging, most modern equipment has automated TGC, but retains the possibility of manual adjustment.
For practical medical purposes, the penetration for good imaging is about 10 - 20 cm at 3.5 MHz (adult cardiac), 5 - 10 cm at about 5 MHZ (pediatric cardiac), 2-5 cm at 7.5 MHz, 1-4 cm at 10 MHZ, the last two frequencies being in the vascular domain. However, one method to bypass some of the attenuation problem is by harmonic imaging. Thus the beam is transmitted at a certain frequency, and the received signal is analysed at twice that frequency (Fourier analysis). This increases the signal to noise ratio of the reflected signal, especially at the deepest parts of the image, without a similar loss of resolution.
Doppler Effect
The Doppler effect was discovered by Christian Andreas Doppler (1803 - 1853), and shows how the frequency of an emitted wave changes with the velocity of the emitter or observer.
The basis for the Doppler effect is that the propagation velocity of the waves in a medium is constant, so the waves propagates with the same velocity in all directions, and thus there is no addition of the velocity of the waves and / nor the velocity of the source. Thus, as the source moves in the direction of the propagation of the waves, this does not increase the propagation velocity of the waves, but instead increases the frequency.
This can be observed in everyday phenomena such as the sound of f.i.. an ambulance siren. The pitch (frequency) is higher when the ambulance is coming / travelling towards the observer, hanging as it passes, and lower as it goes / moves away.
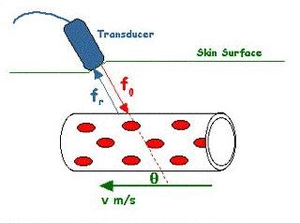
If the sound source is stationary, the effect on / of moving the observer is similar. The train will meet the wave crest with shorter intervals, as the train moves into the incoming sound. In ultrasound, the wave is sent from a stationary transducer, the moving blood or muscle is firstly moving towards the transducer and then following the reflected wave towards the transducer, thus the Doppler shift is approximately twice as great. In the case of reflected ultrasound, the Doppler shift is:
where is the angle between the direction of the motion and the ultrasound beam (insonation angle).
Thus, in the case of reflected ultrasound, the velocity of blood or tissue can be measured by the Doppler shift of the reflected ultrasound:
Basically, the Doppler effect can be used to measure blood and tissue velocities from the Doppler shift of reflected ultrasound:
where v is the blood or tissue velocity, c is the sound velocity in tissue, f0 is the transmitted frequency, fD is the Doppler shift of reflected ultrasound and is the insonation angle, between the ultrasound beam and the direction of motion (velocity vector).
Links[edit | edit source]
Next chapter: 6.3 X-RAY
Back to Contents

