3.2 ECG
Electrocardiograph (ECG reading device) captures differences in electrical potential on the surface of the skin, which arise due to depolarization and repolarization of cardiac muscle. Graphic recording is called electrocardiogram. This record is gained by electrodes, amplified by amplifiers and graphically done on paper or screen.
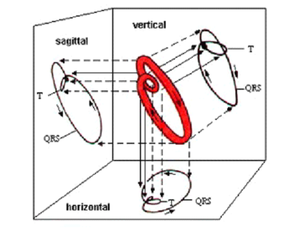
ECG shows the heart irritation but does not show contraction (which can be viewed by other methods such as echocardiography, cardiac ultrasound examination). Oscillations and waves of the ECG are the result of projection of the total electric dipole of heart muscle - the heart vector.
Vector ECG indicates the direction of propagation of the resulting electrical potential. The resultant vector ECG is given by the size and location of individual parts of the heart.
Electrical heart axis (Figure 3.5) refers to the general direction of the heart's depolarization wavefront in the frontal plane (depolarization chambers) and is influenced by the anatomical location of heart in the chest.
Figure 3.5: Heart electric vector location
Electrocardiographic leads - the basic division
- Bipolar limb leads - I, II, III
- Unipolar limb leads - aVR, aVL, aVF,
- Thoracic unipolar leads - V1, V2, V3, V4, V5, V6.
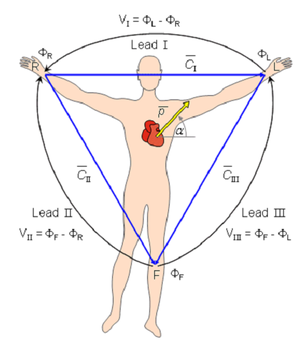
Bipolar limb leads according to Einthoven (Figure 3.6) - referred to as standard leads - have been used since the beginning of electrocardiography. There is a lot of experience with them and cannot be overlooked in routine practice. They record cardiac potentials projection to the frontal plane. In a bipolar connection is measured potential difference between two active electrodes. Leads are designated by Roman numerals I, II, III.
- Lead I - connects right hand and left hand.
- Lead II - connects right arm and left leg.
- Lead III - connects the left arm and left leg.
If we connect these three points we get the well-known Einthoven’s triangle. If we mark potentials as Φ R (right hand), Φ L (left hand) and Φ F (left feet) we limb potentials as:
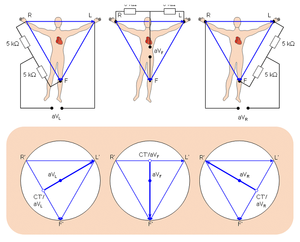
Unipolar limb leads (Figure 3.7) captured by Wilson's technique (VR, VL, VF) have the disadvantage of small fluctuations and therefore unipolar leads are used according to Goldberger (aVR, aVL, aVF), where the A’s mean augmented. They are unipolar leads, each lead-indicates the potential of one electrode. Each reference point in the circuit is made up of two resistors connecting the remaining electrodes.
Figure 3.6: Bipolar leads connection diagram
Figure 3.7: Unipolar limb leads connection diagram
The potential is given by:
- aVR – difference of voltage between left hand, left leg and right hand
- aVL – difference of voltage between right hand, left leg and left hand
- aVF – difference of voltage between right hand, left hand and left leg.
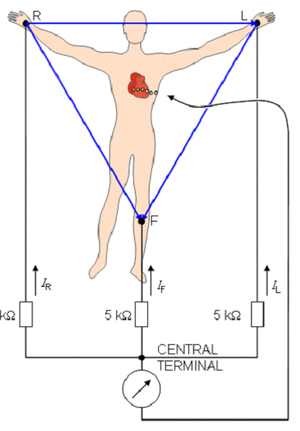
Unipolar chest leads according to Wilson (Figure 3.8): While the limb leads show the heart's electrical activity in the frontal plane, thoracic unipolar leads monitor heart's electrical activity in the horizontal plane. Together, they provide a spatial picture of cardiac electric field. Unipolar leads capture potentials from one place (different electrode) against the second place (indifferent electrode). Indifferent electrode is represented by Wilson's central terminal.
Figure 3.8: Wilson's central terminal connection diagram
Chest electrodes are attached:
- V1 chest lead - fourth intercostal space to the right of the sternum
- V2 chest lead - fourth intercostal space to the left of the sternum
- V3 chest lead - between V2 and V4
- V4 chest lead - fifth intercostal space in midclavicular line
- V5 chest lead - fifth intercostal space in the front axillary line
- V6 chest lead - fifth intercostal space in mid axillary line
Chest leads V1, V2 and V3 capture potentials of right heart. Chest leads V5 and V6 capture potentials of left heart.
ECG curve - registration, description and monitoring
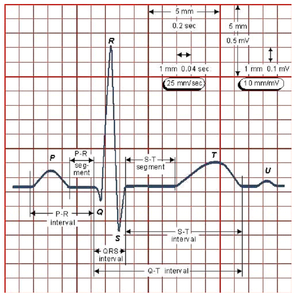
A typical ECG tracing of the cardiac cycle (heartbeat) consists of a P wave, a QRS complex, a T wave and a U wave which is normally visible in 50 to 75% of ECGs. The baseline voltage of the electrocardiogram is known as the isoelectric line. Typically the isoelectric line is measured as the portion of the tracing following the T wave and preceding the next P wave.
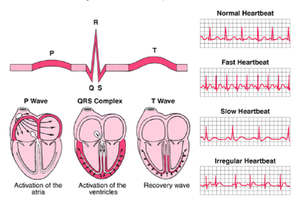
Depolarization, repolarization and ventricular fibrillation lead to the emergence of different waves and oscillations in ECG. There are three waves: P, T, U three oscillations Q, R, S and these gives intervals PQ, PR, QT, PT, that are used to determine status of heart (Figure 3.9 and 3.10).
Figure 3.9: ECG curve description
Figure 3.10: ECG curve generation
P wave - During normal atrial depolarization, the main electrical vector is directed from the SA node towards the AV node, and spreads from the right atrium to the left atrium. This turns into the P wave on the ECG.
PQ (PR) interval - the PR interval is measured from the beginning of the P wave to the beginning of the QRS complex. The PR interval reflects the time the electrical impulse takes to travel from the sinus node through the AV node and entering the ventricles. The PR interval is therefore a good estimate of AV node function. The PR segment connects the P wave and the QRS complex. This coincides with the electrical conduction from the AV node to the bundle of His to the bundle branches and then to the Purkinje fibres. This electrical activity does not produce a contraction directly and is merely traveling down towards the ventricles and this shows up flat on the ECG. The PR interval is more clinically relevant.
QRS complex - the QRS complex reflects the rapid depolarization of the right and left ventricles. They have a large muscle mass compared to the atria and so the QRS complex usually has much larger amplitude than the P-wave
S-T interval - the ST interval is measured from the J point to the end of the T wave.
Q-T interval - the QT interval is measured from the beginning of the QRS complex to the end of the T wave. A prolonged QT interval is a risk factor for ventricular tachyarrhythmia and sudden death. It varies with heart rate and for clinical relevance requires a correction for this, giving the QTc
T wave - the T wave represents the repolarization (or recovery) of the ventricles. The interval from the beginning of the QRS complex to the apex of the T wave is referred to as the absolute refractory period. The last half of the T wave is referred to as the relative refractory period (or vulnerable period).
U wave - the U wave is hypothesized to be caused by the repolarization of the interventricular septum. They normally have low amplitude, and even more often completely absent. They always follow the T wave and also follow the same direction in amplitude. If they are too prominent we suspect hypokalaemia, hypercalcemia or hyperthyroidism usually.

