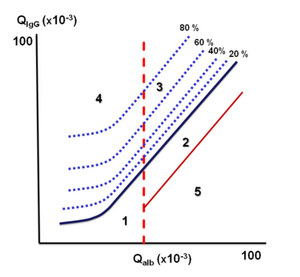
Reiber Diagram
The Reiber diagram is used to distinguish whether a high concentration of immunoglobulins in the cerebrospinal fluid is caused by a blood-brain barrier disorder or by intrathecal production[1]. In principle, it is based on a comparison of the albumin quotient and the immunoglobulin quotient (as quotient we refer to the ratio of the concentrations of the given analyte in the cerebrospinal fluid and in the blood serum).
Albumin is formed exclusively in the liver , it cannot have intrathecal production. A rise in the albumin quotient is therefore always a sign of a disorder of the blood-brain barrier (in the figure, the area to the right of the vertical dashed line).
Immunoglobulins can, on the one hand, penetrate into the cerebrospinal fluid to an increased extent from the blood when the blood-brain barrier is impaired , and on the other hand, they can be produced directly intrathecally in CNS diseases . The rate at which immunoglobulins from the blood penetrate into the intrathecal space depends on the state of the blood-brain barrier. If its function is preserved or only slightly damaged, proteins diffuse through it at different speeds according to their molecular weight. Albumin permeates more easily than immunoglobulins , the ratio of immunoglobulin to albumin quotients (i.e. immunoglobulin index) is about 0.45 – the initial, low steep part of the Reiber diagram . For more extensive damage the blood-brain barrier loses its selectivity, immunoglobulins pass as easily as albumin; therefore, the right-hand side of the Reiber diagram has a direction of approximately 1.
Evaluation of findings in the cerebrospinal fluid using the Reiber diagram[edit | edit source]
The albumin quotient alone informs us about the state of the blood-liquid barrier; if it is higher than about 7,5 ·10−3 (depends on age, see cerebrospinal fluid for more details ), it is a disorder of the blood-brain barrier .
Comparing the immunoglobulin Q Ig quotient with the albumin QAlb quotient using the Reiber diagram then informs us about the origin of the immunoglobulins in the cerebrospinal fluid. If the plotted values lie on the connecting line (black line in the picture) or in close proximity to it, the immunoglobulins come from the blood . In this case, the increased concentration of immunoglobulins is due only to a disorder of the blood-liquid barrier. In contrast, if the plotted values of QIg and QAlb are well above the line in the Reiber diagram, intrathecal production is present with immunoglobulins. The amount of immunoglobulins synthesized in the intrathecal space can be calculated from the distance of the plotted point from the junction in the Reiber diagram.
In a similar way, not only total immunoglobulins, but also individual classes (especially IgG and IgM) can be evaluated.
Links[edit | edit source]
Related articles[edit | edit source]
Reference[edit | edit source]
Použitá literatura[edit | edit source]
- REIBER, Hansotto. Proteins in cerebrospinal fluid and blood: Barriers, CSF flow rate and source-related dynamics. Restorative Neurology and Neuroscience [online]. 2003, vol. 21, p. 79-96, Available from <http://www.horeiber.de/pdf/6.pdf>. ISSN 0922-6028.
- REIBER, Heinsotto. The hyperbolic function: a mathematical solution of the protein flux/CSF flow model for blood-CSF barrier function A reply to the letter by S. t3hman (J. Neurol. Sci., 126 (1994) 240-242). Journal of the Neurological Sciences [online]. 1994, vol. 126, p. 243-245, Available from <http://www.horeiber.de/pdf/5.pdf>. Letter to Editor. ISSN 0022-510X.

