Forum:Seminar papers/Biophysics/2. LF/2018-2019/Group 4/GH
< Forum:Seminar papers | Biophysics | 2. LF | 2018-2019 | Group 4
Introduction[edit | edit source]
The heart is an organ which pumps blood through the blood vessels of the circulatory system. In the human body this organ is located between the lungs, closer to the left side of the chest. The Sinus Rhythm which can be explained as normal rhythmic heartbeat is established by the sinoatrial node (pacemaker of the heart). This node is the place where electrical signals, which then travel around the heart and cause heart muscles to contract, is created. This signal then travels to the atrioventricular node which passes it to the purkinje fibers letting it transmit the electric charge to the ventricles. Electrocardiography (ECG/EKG) is a rather basic process of recording this electrical activity of the heart in a period of time using electrodes placed on the skin. The tiny voltages at the skin that arise from pattern of depolarizing and repolarizing during each heartbeat can be detected by these electrodes. The procedure is usually performed in order to detect any cardiac problems. In order for electrocardiography to be performed correctly it is important to make sure that the basic structure and some functioning principles of the heart are well understood.
Importance in clinical medicine[edit | edit source]
The ECG is widely used in clinical practice. Mostly used in cardiology and general practice, the procedure can be used as the instrument of early detection of problems with the heart like arrhythmias: ECG is usually performed during checkups to detect any problems. It is also known to be helpful in detecting myocardial infarctions, valve insufficiency, ischemia, etc. Moreover, an ECG can provide a doctor with information about the treatment course, showing positive or negative changes during time. In addition, an ECG can display the issues caused by medication: some drugs can affect the cardiogram, for example anti-arrhythmic medication and in some cases antidepressants and certain antibiotics can cause a long QT. An ECG can also be used in emergency medicine: portable electrocardiographs allow the procedure to happen in the emergency units. Also, continuous ECG monitoring is provided for hospitalized patients like those in ICU or NICU and those under general anesthesia, which allows the medical personnel to react quickly to any problems caused by the patient’s heart.
Literature review[edit | edit source]
ECG records the electrical activity made by the contractions of heart muscles, which is transmitted through the tissues, and then to the skin in the form of changes in electrical potential. ECG electrodes can pick up these changes when they are attached to the skin. A basic ECG setup consists of at least 4 electrodes either placed at the chest or at the extremities. For the extremities the standard nomenclature is (RA = right arm; LA = left arm; RL = right leg; LL = left leg).
An image representing the concept can be found here: https://meds.queensu.ca/central/assets/modules/ts-ecg/normal_ecg.html
Electrocardiogram (ECG/EKG). Represents the overall activity of the heart.
There are different kinds of ECG machines: 3-lead, 5-lead and 12-lead ECG. The 12- lead ECG has 10 electrodes (6 for the chest and 4 for each limb) providing 12 different direction of view for the heart. Each direction of view is called a lead. The 12- lead ECG is made up of three standard limb leads (I, II and III), the augmented limb leads (aVR, aVL and aVF) and the six precordial leads (V1, V2, V3, V4, V5 and V6).
The 6 limb leads looks at the heart in a vertical plane. They are obtained from the electrodes attached to the Right Arm, Left Arm, and Left Leg making the Einthoven's triangle. The measurement of a voltage requires two poles: (zero reference) negative pole to the positive pole (point of view). Leads I, II, & III are bipolar.
- Lead I= right arm to left arm.
- Lead II= right arm to left leg.
- Lead III: left arm to left leg
aVR, aVL and aVF leads are unipolar and are from the midpoints of the I, II, III leads.
An image representing the concept can be found here: https://en.wikipedia.org/wiki/Einthoven%27s_triangle
Each contraction begins in the SA node (pacemaker of the heart). P represents atrial systole. It is when the muscles of the atria depolarize causing a contraction. PR segment represents the period of conduction from the SA to the AV node. Then the signal enters the ventricles through the AV node. It goes from Bundles of His (Q) to Bundles Branches (R) to the Purkinje Fibers (S). The ventricle muscles contract (ventricular depolarization) causing the ventricular systole represented by the QRS complex. ST represents the ventricular diastole/ relaxation of the ventricle muscles. T represents ventricular repolarization. QT represents both depolarization and repolarization of the ventricles.
An image representing the concept can be found here (under the title What does the ECG record): https://www.myvmc.com/banners-heart-health-centre/ecg-ekg-electrocardiogram/
The ECG can tell physicians a vast variety of silent chest problems or provide information about the causes of chest discomfort or pain all while being inexpensive and non-invasive. It is a quick procedure, and available in many hospitals. The few drawbacks include the ECG not being able to show every hidden heart issue. Also, the wires used during ECG restrict movement which may make the patient uncomfortable.
Risks involving ECG could be misinterpretation of the results leading to misdiagnosis. Inaccurate results could result from stress or medication. Rarely, the gel present on the electrodes could cause irritation or inflammation.
Equipment[edit | edit source]
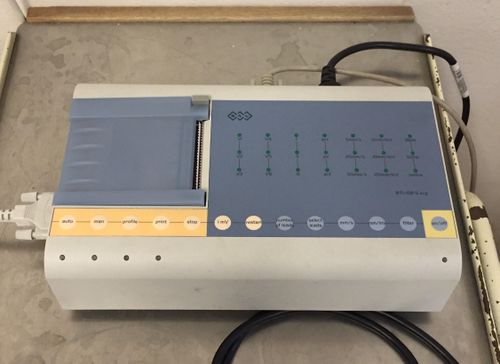
< BTL-08 ECG apparatus>
ECG apparatus is a machine that records a patient’s Electrocardiogram. The BTL-08 ECG apparatus records the ECG curve.
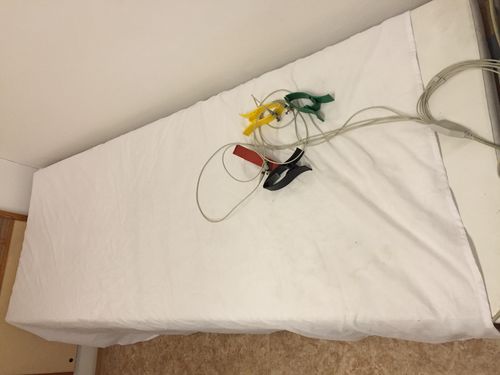
< Electrodes>
Electrodes are sensors which placed on the patient’s body and connected to the ECG apparatus. As a conventional 12-leads ECG, 10 electrodes are needed to be attached to Patient’s limbs and chest and providing 12 perspectives of the heart’s activity. In our project, we use only 4 limb electrodes on the following positions.
- R – red - right wrist
- L – yellow - left wrist
- F – green - left ankle
- N – black - right ankle
< Computer with the BTL 08 Win program>
BTL 08 Win program in computer transform the signals of heart into wave diagrams with detailed analysis. It can also be conducted in either automatic or manual measurement.
Methodology[edit | edit source]
- 1. Turn on the computer
- 2. Run the program “ BTL08 Win”
- 3. Open the ECG Folder and move to the folder of your group
- 4. Click on the New patient icon and fill in the data of the examined person.
- In the ID field, your birth number should be entered. In case you cannot, you can enter an anonymous birth number such as 010101/999
- In the Comment field, you need to fill your basic information that may influence your heart activity such as smoking, alcohol, sport, cholesterol, family and personal anamnesis, BMI, medication.
- 5. Plug all the cables with limb electrodes (red, yellow, green, and black) [Picture of electrodes will be inserted]
- 6. The examined person lies down on the bed. Electrodes are attached to the respective moistened limbs:
- R – red - right wrist
- L – yellow - left wrist
- F – green - left ankle
- N – black - right ankle
- 7. Turn on the ECG apparatus.
- 8. Start the New standard ECG examination and wait until the signal stabilizes.
- 9. Check parameters correctly as below
- Time base : 25mm/s, can be increased to 50mm/s
- Amplitude calibration: usually 10mm/mV, can be set up and down.
- Filter : 50 Hz
- Time constant : choose as long as possible (3.2s)
- 10. Once signal get stabilized, save 10 second by pressing Enter key. After a while and repeat the signal recording twice.
- 11. Terminate signal recording by Esc key.
- 12. Turn off the ECG apparatus and remove the electrodes from the examined person.
- 13. Print out the three records with the following parameters.
- Grid : normal
- Time base : 25mm/s
- Amplitude : usually 10mm/mV
- Print leads : all recorded
- Wave length : 5 sec
- Diagnosis : automatic diagnosis (intervals) ; approved diagnosis (leave it empty )
- Image export : not important
Graphical interpretation of measurements:
- 1. Choose the best readable lead for further evaluation;
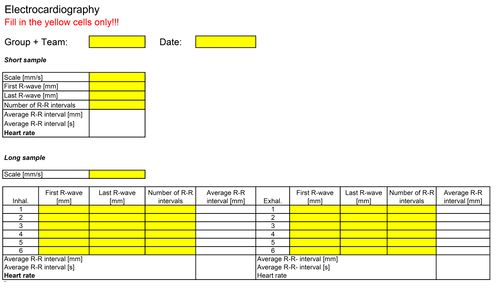
- 2. Measure the individual intervals and amplitudes in the printed record. Fill in the given report paper with the proper units. You need to measure precisely in order to acquire a good result;
- 3. Calculate average R-R interval and heart-rate (frequency) in both required units;
- 4. Draw the lengths of the amplitudes of the QRS vectors to the scheme of Einthoven triangle; using these projections in individual leads restore the vector of the electric axis of the heart.
- 5. Evaluate amplitude [mV] and slope [º] of the axis vector from the drawing, note them down;
- 6. Compare your results to those of the autonomic evaluation and discuss the possible difference and the method itself.
-You will fill in this table as well as given report paper-
Conclusion[edit | edit source]
ECG has an important role in diagnosing patients with a possible cardiac problems, such as a heart attack, pulmonary embolism, arrhythmia etc., which makes it an important procedure that has to be improved each day in order to obtain more detailed information about the patients which can save their lives.
The International Society for Computerized Electrocardiography (ISCE) was founded in 1984 as a non-profit organization which is devoted to the advancement of electrocardiology through the application of computer methods.
There are many scientific researches held around the world in order to develop more advanced devices. One of the latest discoveries of these researches is the new ECG machine called “MyoVista ECG Device” This device uses continuous wavelet transform signal processing and artificial intelligence to predict left ventricular diastolic dysfunction.
References[edit | edit source]
- EKG.Academy, “EKG Waveform Lesson”, 12 Dec. 2018, www.ekg.academy/ekg-waveform-lesson
- iMotions, “What Is ECG (Electrocardiography) and How Does It Work?” , 8. Dec. 2018, www.imotions.com/blog/what-is-ecg/.
- Mayo Foundation for Medical Education and Research, “Electrocardiogram (ECG or EKG).” , 11. Dec. 2018, www.mayoclinic.org/tests-procedures/ekg/about/pac-20384983.
- The Student Physiologist, “The ECG Leads, Polarity and Einthoven’s Triangle”, 11. Dec. 2018, www.thephysiologist.org/study-materials/the-ecg-leads-polarity-and-einthovens-triangle/
- Zubieta University , Professor Poul-Erik Paulev and Professor Gustavo Zubieta-Calleja, “New Human Physiology, Chapter 11 Cardiac action potentials and disorders”, 7. Dec. 2018, http://www.zuniv.net/physiology/book/chapter11.html


