Buffers, buffering capacity, oxidation and reduction, electrode processes (1.LF UK, GM)
This text serves as study material for the subject Medical Chemistry and Biochemistry 1. LF UK
Buffers (swelling solutions, buffer solutions)[edit | edit source]
The acidity of the internal environment in the human body is maintained within a very narrow range of pH values. This is because the properties of proteins and other molecules depend on pH. If there is a significant change in pH, for example, the speed of enzyme reactions, the properties of receptors, transporters and ion channels, etc. will change significantly. It is both the effect of substances that we take in as food or with which our skin comes into contact, as well as the production of acids and bases through metabolic processes.
Buffers (also buffers, buffer solutions, resistant solutions) are involved in maintaining the pH of the environment.
In most textbooks, a buffer is defined as a conjugated pair of acid (or base) that is able to maintain a stable pH within a certain range even after adding a strong acid or base to the system. By conjugate pair we mean an acid (or base) and its salt, which is formed after adding a base (or acid) to the system. It is a pair of substances that change into each other through the gain/loss of one proton. If it is a strong acid (or base), it is (almost) completely dissociated, and therefore all available particles will participate in any reaction (e.g. buffer HCl-KCl, dissociated into H+, Cl- and K+). Far more often, weak acids are used, whose non-dissociated parts (e.g. CH3COOH) represent a storage pool, the splitting of which (into CH3COO- and H+) occurs after the addition of a substance with a different pH.
The exact calculation of theoretical pH is very complicated (temperature, concentration of individual buffer components, activity coefficients, solvent, ionic strength of the system, etc. must be taken into account). Therefore, more often the pH of systems is measured experimentally. The simplest estimate of buffer pH is the Henderson-Hasselbalch equation. It can be derived by logarithmizing equation (1) for the equilibrium constant:
| (1) |
- , resp. ,
where HA (or BOH) represents the acid (base), A- (B+) the anion of the acid (or cation of the base), and square brackets the molar concentration. The given equation is inaccurate, because instead of concentrations, activity must be taken into account. For the acid and its salt, the simplified equation (2) applies:
| (2) |
- ;
similarly for the base and its salt equation (3):
| (3) |
- , so .
The composition of the buffers is more or less complicated and depends primarily on the purposes for which the chosen system is to be used. The optimal activity area of the selected buffer is determined by its composition. Among the simpler ones, we can mention the Clark–Lube buffer (HCl+KCl) pH 1.1–2.2; citrate pH 2.2–3.6; phosphate (NaH2PO4 + Na2HPO4, used for blood pH range) – pH 5.8–8.0. However, multi-component buffers exist and are also used, the effective range of which covers practically the entire pH range, e.g. Britton's–Robinson's, whose effective range of activity ranges from pH 1.8 to almost 12.
The number of moles of monoacid and salt in the buffer and the amount of monoacid added to the buffer can be calculated according to equations (4):
| (4) |
- ; ;
To calculate the theoretical pH value of buffers consisting of a weak acid and its salt after the addition of acid, the relation (5a) derived from Henderson-Hasselbalch equation (2).
| (5a) |
and after adding the principle to the same system then equation (5b):
| (5b) |
where the index "buffer" refers to the volumes before the addition of acid (or base), "salt" to the salt contained in the buffer, "acid" to the acid in the buffer and "addition" only to the values of the addition itself before mixing with the buffer.
An analogous relationship derived from equation (3) is used for a weak base and its salt.
The simplest calculations can be performed for uni-univalent systems, i.e. on the assumption that the buffer consists of a monovalent weak acid and its salt (e.g. CH3COOH/CH3COONa, NaH2PO4/Na2HPO4) and a monovalent base or acid is also added (e.g. HCl or NaOH).
The theoretical pH value of the buffer often differs from the experimentally determined one (whether due to non-idealities or intentionally neglected factors during their calculation (ionic strength, temperature, solvent, etc.)). Therefore, buffers are often prepared in two stages: first, the components are mixed in a calculated (tabulated) ratio so that the result corresponds to the desired pH value, then its actual pH value is measured using a properly calibrated pH meter, and a sufficiently accurate value is achieved by the appropriate addition of acid or base (after each addition, the system must be properly mixed, let the temperature equalize and read the value of the device only after stabilization).
The amount of a substance whose addition can be compensated for with a buffer is determined by the so-called buffering capacity β. It is mainly determined by the composition and concentration of the buffer. The higher the concentration of the buffer components, the higher the buffering capacity (e.g. for a narrow range of buffers and small expected additions of substances, a low-concentration buffer can be used and vice versa). Buffering capacity decreases with buffer dilution. Buffers composed of weak acids and their salts (or weak bases and their salts) with the same substance concentration, i.e., more precisely, for which pH = pK, have the largest capacity. This can be derived from equation (2) and (3), where, with equal concentrations of the acid salt (resp. base), log(1/1) = 0 and pH = pKa (resp. pH = 14 − pKb). At other ratios, it changes according to the logarithm of the ratio of the concentrations of the individual components. In general, it is stated in the literature that a "simple" buffer, composed of two components, is usable in the pH range from (pKa − 1) to (pKa + 1) (ie, the ratio of acid to salt ranges from 10: 1 after 1:10).
A simplified, empirical calculation of the buffering capacity β is performed according to the following equation (6):
| (6) |
- ,
where "d" denotes the derivative, Δca change in molar concentration of acid, Δcb change in molar concentration of base, ΔpH change in pH achieved by addition of acid Δca or base Δcb.
A more accurate relationship enabling the calculation of β is obtained by differential modification of Henderson-Hasselbalch equation (the so-called van Slyke equation - read "fan of Slyke") (7a):
| (7a) |
where ca denotes the total concentration of the buffer (the sum of the molar concentrations of the buffer components), i.e. ca = [HA] + [A-], and Ka the dissociation constant (acidic components) of the buffer system (the constant 2.3 is approximate and ensures the conversion of natural and decadal logarithm).
An analogous equation (7b) applies to the buffering capacity of mixtures of weak bases and conjugated acids:
| (7b) |
The first part of the equation also includes the buffering capacity of strong electrolytes (strong acids and strong bases), while a simplified formula is used for the approximate calculation of the buffering capacity of buffers created from weak acids of the HA type. To calculate the buffering capacity, relation (7c) is also often used, which is created by a simple modification of relation (7a):
| (7c) |
Buffer preparation[edit | edit source]
The preparation of buffers is based either on solutions of weak acids or bases and their salts, or from solid salts of polyhydric acids or their solutions, or a weak acid is partially neutralized, or base with a strong base, or acid.
If we prepare the buffer exactly according to the instructions and measure its pH, the pH may not always correspond exactly to the theoretically calculated value. Especially in more concentrated solutions, the activity of hydrogen ions tends to be lower than their concentration. The weights of individual components for the preparation of the most common buffers can be found in the tables.
Acetate buffer titration[edit | edit source]
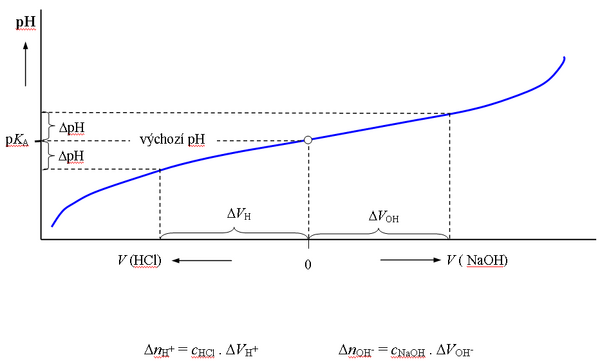
The graphical representation of the Henderson-Hasselbach equation is the titration curve of a weak acid or base. When titrating the buffer, i.e. when dilute solutions of a strong acid or base are gradually added to the buffer solution, the pH initially changes only slowly, after exceeding the value of pH = KA ± 1, the changes are already significant. The buffering capacity for any pH value can be determined from the course of the titration curve of the buffer of a given concentration (cHB + cnB).
By mixing equal volumes of solutions of acetic acid and sodium acetate with the same substance concentration, a buffer with a ratio of components of 1:1 is created, the pH of which is equal to the pKA of acetic acid (4.75).
Electrochemistry[edit | edit source]
Electrochemical methods can be divided into two large groups. The first consists of methods based on oxidation-reduction processes that take place on metal electrodes. They use electrochemical cells that are either in equilibrium (potentiometry), or an electric current flows through them and the system changes over time (voltammetry, coulometry). The second group of electrochemical techniques consists of methods that measure other electrical properties of substances – e.g. conductivity (conductometry), impedance and capacity.
Electrode processes[edit | edit source]
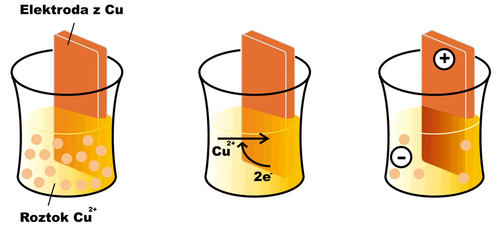
__If we dip an electrode made of the same metal (in this case copper) into a solution of a metal ion (e.g. Cu2+) an oxidation-reduction reaction begins to take place on the surface of the electrode
- Cu2+ + 2 e− < = > Cu
In the case of copper, under normal conditions, the equilibrium of the mentioned reaction is shifted somewhat to the right (for other substances, e.g. zinc, the opposite can be the case). A layer of reduced copper is deposited on the surface of the electrode, and the electrode gradually acquires a positive charge, as free electrons are drawn from it. The solution in which the electrode is immersed, on the other hand, acquires a negative charge, as Cu2+ cations are depleted from it without replacement . After a certain time, the reaction stops, as electrostatic forces prevent the further movement of charged particles, and an equilibrium characterized by a certain electric potential at the electrode is established. The effort of the electrode to receive or give up electrons is characterized by the so-called reduction potential (Ered). If all components of the electrode reaction have an activity equal to one, or are in a form to which the standard state is related (e.g. solid state), we speak of a standard reduction potential (E0red).
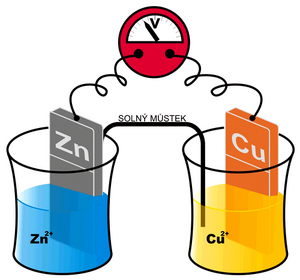
We cannot measure the potential created in the manner described above on one electrode directly. However, we can create a cell composed of two different electrodes – eg metals (generally semi-cells) and two corresponding electrolytes. An example can be the so-called Daniell cell: Cu in a solution of Cu 2+ and Zn in a solution of Zn 2+ . Depending on whether individual metals tend to be more oxidized or reduced, we can arrange them in the so-called Beketov electrochemical series (K, Ca, Al, Zn, Fe, Ni, Pb, H, Bi, Cu, Hg, Ag, Au). For these purposes, the electrode potential of the so-called standard hydrogen electrode is considered ero. Metals that have a negative standard reduction potential and therefore readily donate an electron are in the row to the left of hydrogen (ie. potassium tends to oxidize to K+). Metal ions that are on the right, on the other hand, accept electrons easily (eg. Ag+ is easily reduced to Ag)and their standard reduction potential is positive.
Daniell's article mentioned above is schematically written Zn | Zn2+ || Cu2+ | Cu (the more negative metal is written to the left). A redox reaction takes place at the zinc electrode
- Zn2+ + 2 e− < = > Zn,
which has an equilibrium constant KZn and is characterized by a standard reduction potential E0red(Zn);the above reaction takes place on the copper electrode
- Cu2+ + 2 e− < = > Cu
with the equilibrium KCu and the standard reduction potential E0red(Cu). In the given case, KCu > KZn, or E0red(Cu) > E0red(Zn). In other words, copper will be reduced and deposited on the electrode more readily than zinc. Thus, more electrons are consumed from a copper electrode than from a zinc one. Ultimately, the copper electrode will have a positive voltage to the zinc that we can measure.
If we let a current flow between the electrodes, the „convergig" electrons will be supplied to the copper electrode from the zinc electrode, and the resulting process can be written as follows:
- Zn → Zn2+ + 2e−
- Cu2+ + 2e− → Cu
Current will flow through the conductor between the electrodes and the salt bridge until the zinc electrode dissolves, or (which is more likely) until Cu2+ from the electrolyte is consumed, or the second electrolyte becomes saturated with Zn2+ ions (discharge of the electrochemical cell).
The cell voltage is equal to the potential difference of the two electrodes. A cell on which events take place spontaneously („produces“ voltage) is called a galvanic cell (ΔG < 0). If we apply a voltage to it and the events are "forced" by the applied voltage (ΔG > 0), we call such a cell electrolytic.
The electrode processes described are relatively general and take place in a similar way in various systems composed of various metals and ions.
.
pH-metrics[edit | edit source]
Electrochemistry probably gained the most fame thanks to the possibility of measuring pH using a so-called glass electrode. In this case too, we measure the potential between two half-cells, i.e. the measuring (indicator) and the reference electrode. In practice, the reference electrode is often built into one body together with the measuring electrode - we are talking about a combined pH-metric electrode.
In contrast to the electrochemical cells described above, where voltage is produced as a result of the connection of different metals (reduction and oxidation), with a glass electrode the voltage is produced as a result of exchange events. These take place between the ions "settled" in the crystal lattice of the glass (membrane) and the ions in the solution. On the relatively regular silicate crystal lattice of glass, ions, mainly hydrogen and alkali metals (e.g. sodium), are bound by electrostatic forces. When in contact with the solution, a solvated layer is formed on the surface, in which alkali metal ions (e.g. sodium) and hydrogen ions are exchanged between the solution and the glass.
Equation (9) holds for the glass hydrogen electrode:
where Ks is the selectivity constant, which indicates how selectively the electrode reacts to one or the other ion. If its value is low enough, the term of equation (9) that contains it can be neglected and a simplified form can be used. The term "const." includes the standard reduction potential, the method of preparation of the electrode, the type and composition of the glass, the quality of the surface, the "age" and the internal filling of the electrode. For simplicity, the decimal logarithm is used in most devices and the variables are summed up in one "constant" numerical value of 2.3 (for a temperature of 25 °C).
At a constant potential of the reference electrode, the measured voltage is directly proportional to the pH of the analyzed solution in a large part of the entire range of possible pHs. In reality, one cannot rely on theoretical calibration parameters and it is necessary to perform calibration using two or three solutions with known pH values. Modern devices calculate the direction of the calibration line (slope) according to the measured values, generally for non-linear dependences of the electrode sensitivity, at the same time a temperature correction is made. The device "remembers" these "calibration parameters" and processes the measured data according to them. Calibration must be repeated regularly, the more often the electrode is older. At the same time, care must be taken to ensure that the calibration takes place under the same conditions as the real measurement (aqueous environment, non-aqueous environment, alcohol content, etc.). Other inaccuracies that must be taken into account are committed by the glass electrode in the acidic and alkaline pH range (Alkaline (positive) error - in the strongly alkaline region and acidic (negative) error at pH < 1).
The time constant of the response is also an important parameter, usually around 15 to 60 s for a glass electrode. The length of the response can also be negatively affected by the composition of the solution - e.g. colloid and the concentration of the measured ion - the equilibrium is established many times longer.
Electrolysis[edit | edit source]
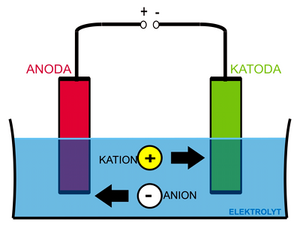
__In the interpretation of electrode events , we assumed that the system is in an equilibrium state. Let us now consider what happens if we apply voltage to the electrodes from an external source (electrolytic cell, ΔG > 0). The ongoing events will be governed by Faraday's laws . In order for electrolytic reactions to take place, the voltage on the electrodes must exceed a certain value - the breakdown voltage (corresponds to the sum of the standard electrode potentials for individual reactions).
As an example, we will use a system consisting of two inert (platinum) electrodes in an aqueous solution of sodium chloride.
If we apply a voltage to the electrodes, the ions in the solution begin to travel according to their charge, Na+ and H+ cations to the cathode and Cl− and OH− anions to the anode. Reactions will take place at the cathode (and in its immediate vicinity):
- 2 H+ + 2 e− → H2 ↑
and (at higher voltage):
- Na+ + e− → Na
- 2 Na + 2 H2O → 2 Na+ + 2 OH− + H2 ↑
A reaction will take place at anode:
- 2 OH− → H2O + ½ O2 ↑ + 2 e−
and (at higher voltage):
- 2 Cl− → Cl2 + 2 e−
- Chlorine will be partly released as a gas, partly it will further react with water to form hydrochloric acid and hypochlorous acid:
- Cl2 + H2O → H+ + Cl− + HClO
The resulting gases will escape from the system (in this case, it is therefore an irreversible event). We also know the above example from practice - notice, for example, the bubbles at the electrodes during electrophoresis.
Use[edit | edit source]
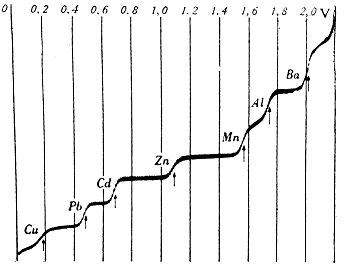
|
| Polarographic curve, dependence of current on voltage. Taken from [1] |
This phenomenon is also used, for example, in polarography. Simply put, if we gradually increase the voltage across the electrodes, only a small current will initially flow through the system. After reaching the breakdown voltage, characteristic of the respective redox couple, electrolytic processes begin to take place on the surface of the measuring electrode and the current increases sharply (the rising part of the polarographic curve). Since this reaction is very fast, the ions around the electrode will soon be depleted. New ions reach the surface of the electrode by diffusion, the speed of which is limited, so that the intensity of the current does not change much (flat plateau). If we construct a graph of the dependence of the current on the input voltage, we get a step-like polarographic curve.
Links[edit | edit source]
Related articles[edit | edit source]
References[edit | edit source]
- NAVRÁTIL, T. – MALBOHAN, I.M. Fyzikální a analytická chemie [online]. [cit. 2009-08-02]. <http://biochemie.euweb.cz/Biochemie/Fyzikal_chemie.zip>.
- LIMOJOE,. Pufr [online]. [cit. 2009-08-31]. <https://cs.wikipedia.org/wiki/Pufr>.
- KRAML, J. Odměrná analýza II : Návody k praktickým cvičením z lékařské biochemie. 1. edition. 1999. pp. 59-63. ISBN 80-246-0020-X.
- KLOUDA, P. Moderní analytické metody. 1. edition. 1996. ISBN 80-902155-0-5.
- VEJRAŽKA, Martin. Elektrochemie [online]. [cit. 2009-08-02]. <https://portal.lf1.cuni.cz/clanek-819-elektrochemie>.
- ŠPIČKA, Ladislav. Elektrolýza [online]. [cit. 2009-08-02]. <http://wwwold.tf.czu.cz/scripta/chemie4.rtf>.
- KOTOUČEK, M – SKOPALOVÁ, J – ADAMOVSKÝ, P. Příklady z analytické chemie [online]. Univerzita Palackého, [cit. 2009-08-31]. <http://ach.upol.cz/ucebnice/>.
- KOTOUČEK, M – SKOPALOVÁ, J – ADAMOVSKÝ, P. Výpočty z elektroanalytických metod [online]. Univerzita Palackého, [cit. 2009-08-31]. <http://ach.upol.cz/ucebnice2/>.
- ↑ CANOV, Michael. Polarografie [online]. [cit. 2018-10-20]. <http://canov.jergym.cz/analchem/polar.htm>.

![{\displaystyle K_{a}={\frac {[{\mbox{H}}^{+}]\cdot [{\mbox{A}}^{-}]}{[{\mbox{HA}}]}}}](https://wikimedia.org/api/rest_v1/media/math/render/svg/0cd2bf37e1f5a2b89f666a7ba2aa8c09d368350a)
![{\displaystyle K_{b}={\frac {[{\mbox{B}}^{+}]\cdot [{\mbox{OH}}^{-}]}{[{\mbox{BOH}}]}}}](https://wikimedia.org/api/rest_v1/media/math/render/svg/cbd88ae04c0b08db26cd7e79c1f4fa0d2f28bd12)
![{\displaystyle pH=pK_{a}+\log {\frac {[{\mbox{A}}^{-}]}{[{\mbox{HA}}]}}}](https://wikimedia.org/api/rest_v1/media/math/render/svg/4ebd78d7b44071f1ebe762ea465503f0430c1c9f)
![{\displaystyle pOH=pK_{b}+\log {\frac {[{\mbox{B}}^{+}]}{[{\mbox{BOH}}]}}}](https://wikimedia.org/api/rest_v1/media/math/render/svg/a8362dfbd70e371fbb02c74e02d6703e7badd096)
![{\displaystyle pH=14-pK_{b}-\log {\frac {[{\mbox{B}}^{+}]}{[{\mbox{BOH}}]}}}](https://wikimedia.org/api/rest_v1/media/math/render/svg/c73cea315f6667c9cc722d71ad1f33c2c768b884)
![{\displaystyle n_{\text{salt}}=[{\mbox{A}}^{-}]\cdot V_{\text{buffer}}}](https://wikimedia.org/api/rest_v1/media/math/render/svg/9bc487ca510dac91e2fc00aa1fb618a2806b96c4)
![{\displaystyle n_{\text{acid}}=[{\mbox{HA}}]\cdot V_{\text{buffer}}}](https://wikimedia.org/api/rest_v1/media/math/render/svg/c1b4960e46c22f4d28628f7c12a7b36a47043384)
![{\displaystyle n_{\text{addition}}=[{\mbox{H}}^{+}]\cdot V_{\text{addition}}}](https://wikimedia.org/api/rest_v1/media/math/render/svg/75febf7cb90d3d7d004621caf8443be78ae2ff61)


![{\displaystyle \beta =2,3\cdot \left([{\mbox{H}}^{+}]+[{\mbox{OH}}^{-}]+{\frac {K_{a}\cdot c_{a}\cdot [{\mbox{H}}^{+}]}{([{\mbox{H}}^{+}]+K_{a})^{2}}}\right)\approx 2,3\cdot c_{a}\cdot {\frac {K_{a}\cdot [{\mbox{H}}^{+}]}{(K_{a}+[{\mbox{H}}^{+}])^{2}}}=2,3\cdot [{\mbox{A}}^{-}]\cdot \left(1-{\frac {[{\mbox{A}}^{-}]}{c_{a}}}\right)}](https://wikimedia.org/api/rest_v1/media/math/render/svg/d8fcb60de555183f8296fd5853e1059acc946358)
![{\displaystyle \beta =2,3\cdot \left([{\mbox{H}}^{+}]+[{\mbox{OH}}^{-}]+{\frac {K_{b}\cdot c_{b}\cdot [{\mbox{OH}}^{-}]}{([{\mbox{OH}}^{-}]+K_{b})^{2}}}\right)\approx 2,3\cdot c_{b}\cdot {\frac {K_{b}\cdot [{\mbox{OH}}^{-}]}{(K_{b}+[{\mbox{OH}}^{-}])^{2}}}}](https://wikimedia.org/api/rest_v1/media/math/render/svg/b2edee4fb8c0ec33c5e34b12019d29febc31682b)
![{\displaystyle \beta =2,3\cdot [{\mbox{A}}^{-}]\cdot \left(1-{\frac {[{\mbox{A}}^{-}]}{c_{a}}}\right)}](https://wikimedia.org/api/rest_v1/media/math/render/svg/dad6ad8348578a06b70a9e1afda515bbf7da1b3b)
