Threshold of Hearing


The Hearing Threshold[edit | edit source]
Definition[edit | edit source]
The hearing threshold is defined as the lowest threshold of acoustic pressure sensation , possible to perceive by an organism. It is a subjective value which may differ individually. The hearing threshold forms the lowest limit of the hearing range ( the highest limit is formed by the threshold of pain).
Explanation and background information[edit | edit source]
Sound itself is a mechanical wave propagating longitudinally through a medium.
To understand the unit and the value of the hearing threshold we should summarize some important related information :
Sound pressure, or P , refers to pressure variations in a compressible transfer medium (e.g. air), resulting from the propagation of the sound. The sound pressure caused by vibrations is converted in our eardrum into movements of the ossicles and ,after transmission, formed in the inner ear to auditory sensations. It´s unit is Pascal.
So to say it is a force F acting on an area A (our eardrum in this example).

Formula for sound pressure
The lowest value for audible sound pressure is 2·10-5 Pascal.
At this point it is important to remember three facts about the human ear:
1.) Our sensitivity for acoustic sensation can be differentiated by the human being into a scale of 12 values for the sound intensity . For practical use we thus use a logarithmic scale (see also under the point "Phone" downwards)
2.) The human ear is rather a detector for energy transmission , than for sound itself. The signals are converted by special sensory cells in our ear.
3.) The sensitivity of hearing is directly dependent on the frequency .
The Sound level is described by a sound intensity I , which is related to a fixed intensity I0 ( = 10-12 W/m2), which causes a barely perceptible sound sensation at the frequency 1000 Hz.

Formula of sound intensity level
The value dB (Decibel) which though seems like a unit is though a dimensionless number because it reflects the ratio between two (sound) intensities !
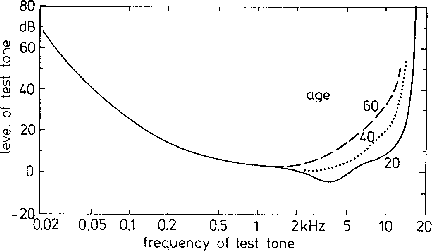 Graph of the threhshold of hearing ( compared for different ages)
The more the threshold passes towards lower sound intensity, the more sensitive the ear responds to the corresponding frequency. In this graph it is seen that the acoustic sensitivity is best around frequencies of 3 kHz. This is clearly seen in the lowering of the threshold of hearing in "valley" formed by the graph. In this area, a very low intensity level is enough to cause a hearing sensation.
For older people, the graph arises more sharply upwards around lowest value (0 dB for young, normal hearing people ), so it is necessary to increase the dB for the same frequency to hear something. This is why especially for older people or a person with problems of hearing it is an important value, e.g. to adapt hearing aid devices.
To simplify things and to connect the sound intensity with the frequency, the unit Phon was introduced, which determined the loudness of a pure tone .
It orientates at a fixed frequency of 1000 Hz for different Sound intensities in dB. So for example a tone with the sound intensity of 30 dB is 30 Phon loud.

It is important to mention that the phon value is not proportional to the perceived volume. A sound with 80 phon is not twice as loud as a sound of 40 phon, but 16 times as loud!
Determination of the hearing threshold[edit | edit source]
Methods which are used to determine the individuals hearing threshold are called psychophysical methods. This name derived by the measurement, consisting of a physical signal (the sound) which is perceived by the individual through his sense-organs and changed in his nervous system into a psychological response , which he reflects to the outside by giving e.g. a hand signal to the examiner.
To determine your subjective audible sensitivity it is possible to make an audiogram. This measurement is frequency dependent and gives the test person tones in different loudness levels on a air countucted ear phone, and on a bone conducted ear phone afterwards (bone conductor for comparison with the vibration sensitivity in the ear canal). It is necessary for the examination that the test person is pressing a button in the moment he can perceive the signal to show the examiner/physician that he is able to hear the tone at a certain frequency/sound level.
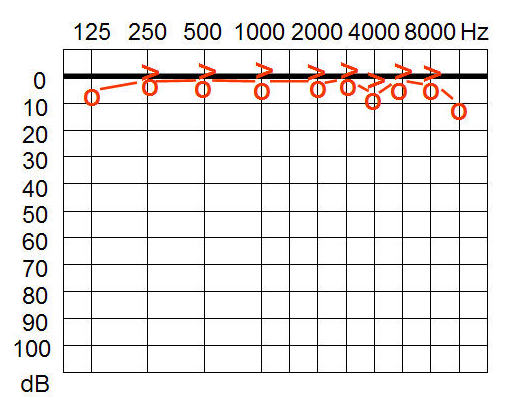 Example of an audiogram of a normal hearing person
 Example for a person who is hearing impaired.
Medical importance[edit | edit source]
The threshold of hearing can not only differ amongst people , but also due to pathological reasons differ among your left and your right ear. To determine this difference it is possible for example to use the Fowler Test, which is a audiometric procedure, using signal for both ears and compares the test results.
Pathologically the absolute threshold of hearing can be influenced by being exposed to loud noise over a long time (as an industrial construction worker e.g.) or by listening to very loud music over head speakers etc. The small, outer hair cells in the human ear are able to transfer received acoustic signals and to enhance quiet sounds or to lessen loud sounds. If those cells are damaged due to the mentioned factors , the absolute threshold is raised , the capability of enhancement of lower intensity acoustic signals is blocked. On the other hand very loud signals cant be reduced so they appear very uncomfortable and loud. This psychoacoustic phenomenon is called Recruitment effect.
References[edit | edit source]
- Literature , Thieme, Walter Seibt, Physik für Mediziner
- blog.crystalhearinguk.co.uk/wp-content/uploads/2009/11/equalloudnesscontour1.jpg
- en.wikipedia.org/wiki/Sound_intensity
- upload.wikimedia.org/math/a/c/1/ac1c69c51f19329589a22a76366e323d.png
- upload.wikimedia.org/math/8/5/d/85dd541f98b68b256119a86cae7c8be5.png
- ccrma.stanford.edu/~jos/bosse/img24.png
- upload.wikimedia.org/wikipedia/commons/f/fe/Tonaud_w_norm.jpg
- upload.wikimedia.org/wikipedia/commons/0/03/Tonaudiogramm_w_sens.jpg