File:Flow cytometry illustrative example.jpg

Original file (1,920 × 1,112 pixels, file size: 253 KB, MIME type: image/jpeg)
Summary[edit | edit source]
- Description
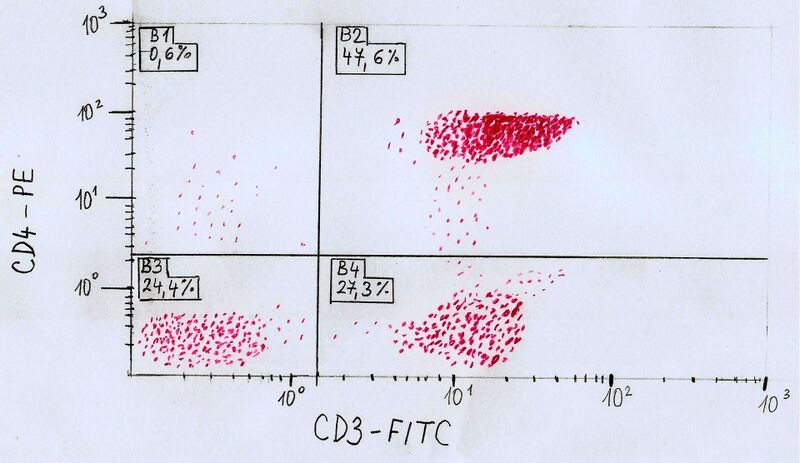
- Illustrative example of flow cytometry result - detailed description on the page flow cytometry (illustrative example section) https://www.wikiskripta.eu/w/Pr%C5%AFtokov%C3%A1_cytometrie and also see below;
own drawing inspired by a picture from the presentation of the Faculty of Medicine, Charles University in Pilsen: Flow cytometry (2.c seminar flow cytometry.ppt, 9th page of the presentation) Detailed description: The x-axis is plotted for one of the parameters. In this case, the presence of the epitope CD3, respectively fluorochrome FITC (Fluoresceinisothiocyanate), which is bound to a monoclonal antibody against the CD3 epitope (antigen). The CD3 epitope (CD=Clusters of Differentiation, so-called differentiation characters, signs of a defined structure recognizable by a monoclonal antibody, currently more than 200 antibodies are characterized and labeled on human leukocytes) is present on the surface of lymphocytes. The second parameter is plotted on the y-axis. In this case, it is the epitope CD4, respectively, the binding of fluorochrome PE (Phycoerythrin) to a monoclonal antibody against the CD4 epitope is recorded. The CD4 epitope is found in the subpopulation of helper lymphocytes. The graph is divided into 4 quadrants.
- In quadrant 1, cells are positive only for the character plotted on the y-axis, i.e. in this particular case cells positive for CD4 antigen (in this illustrative example, 0.6% of cells).
- In quadrant 2, cells are positive for characters plotted on both axes (x,y), i.e. cells of this quadrant contain both antigens (CD3 and CD4). In this illustrative example, the positivity rate of both antigens is approximately 47.6%.
- Cells of the 3rd quadrant are negative for both traits. In the illustrative example, 24.4% of cells are located in this quadrant.
- In quadrant 4, cells are positive only for the x-axis character, in this case only for the CD4 antigen. About 27.3% of cells are located in the fourth quadrant.
The relative intensity of fluorescence is plotted on the axes on an exponential scale.
- Author
- Jana Lomozová
- Source
- own work
- Date
- 2013-12-04
File history
Click on a date/time to view the file as it appeared at that time.
| Date/Time | Thumbnail | Dimensions | User | Comment | |
|---|---|---|---|---|---|
| current | 00:07, 10 December 2022 | | 1,920 × 1,112 (253 KB) | Fahnrica (talk | contribs) | {{File |description = Illustrative example of flow cytometry result - detailed description on the page flow cytometry (illustrative example section) https://www.wikiskripta.eu/w/Pr%C5%AFtokov%C3%A1_cytometrie and also see below; own drawing inspired by a picture from the presentation of the Faculty of Medicine, Charles University in Pilsen: Flow cytometry (2.c seminar flow cytometry.ppt, 9th page of the presentation) Detailed description: The x-axis is plotted for one of the parameters. In th... |
You cannot overwrite this file.
File usage
The following page uses this file: