Electrocardiography (2. LF UK)/Evaluation
Electrocardiography (2. LF UK)/Evaluation
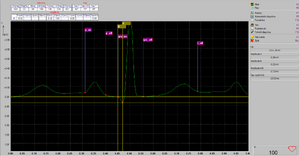
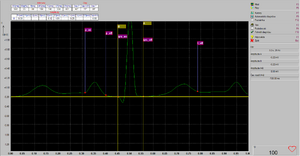
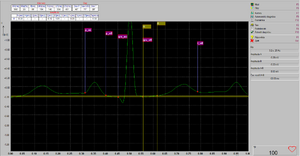
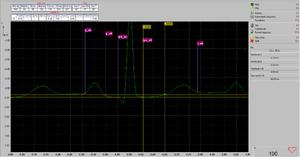
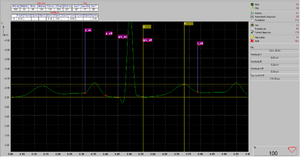
Illustrative screenshots to evaluate the period of the ECG curve
Terminology[edit | edit source]
The ECG curve consists of the following graph elements:
- Waves:
- P
- T
- eventuální U
- Complex:
- QRS, which consists of individual oscillations (waves) Q, R, S (in some cases, cardiologists describe e.g. oscillations R1, R2, etc., but we will not deal with that now)
- Segmenty (neboli úseky): linie mezi vlnami, blízké izoelektrické linii, ve kterých nezaznamenáváme žádnou výraznou EKG aktivitu:
- PQ segment – from the end of the P wave to the beginning of the Q wave or QRS complex
- ST segment – from the end of the QRS complex (or J point) to the beginning of the T wave
In addition to the length (duration) of these individual graph elements on the ECG curve, we also evaluate various intervals, which are time intervals, usually including some waves and a segment. From a diagnostic point of view, we are usually more interested in the lengths of the intervals than the lengths of the segments.
- PQ interval (not to be confused with PQ segment!) – from the beginning of the P wave to the beginning of the Q wave, i.e. it includes the P wave and the PQ segment
- QT interval - from the beginning of the Q wave to the end of the T wave, i.e. it includes the QRS complex, ST segment and T wave
- RR interval – the distance between the R waves of two consecutive periods, thus determines the length of the heart period and can easily be used to calculate the immediate value of the heart rate
The length of the QT interval depends on the instantaneous heart rate - as the length of the heart period increases, so does the length of the QT interval. Therefore, the so-called QTc value, the so-called corrected QT, is introduced. Several different methods can be used for this correction:
The Bazett method is most often used, consisting in the fact that the length of the QT interval is divided by the square root of the RR interval. (This is an empirical method, otherwise from a purely physical point of view the resulting unit would be the square root of a second, which does not make reasonable physical sense. However, the QTc length is still given in ms.)
Display 1×1 conduit[edit | edit source]
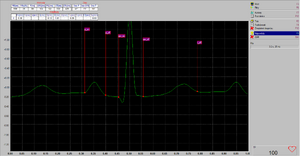
For detailed measurement of one period, we use display in 1×1 mode, where only one period of the ECG signal is displayed in the entire window. From another display mode (e.g. 2x6), we call up the 1x1 mode by double-clicking on the curve of the desired lead.
Or we can click on Averaging in any display mode and this will bring us to the 1×1 mode, in which the averaged signal from several consecutive periods will be displayed. (The lead that will be averaged is determined in the Settings of the entire BTL-08 Win program immediately after starting it. As a rule, the II. Einthoven lead is set, the waves of which are most pronounced at the normal inclination of the electrical heart axis.)
The periods that we want to select for averaging can be marked beforehand by clicking with the left mouse button while holding down the Ctrl key. They don't even have to be consecutive periods. Marked periods are displayed with a brown background. After that, by pressing the right mouse button, we call up a menu on which we can choose whether we want to select the marked periods for averaging or, conversely, all the others except them.
In the 1×1 display mode, we see the markers that the program tried to automatically place on the curve. Of course, he may not be able to do this and it is therefore our most important task to correct and then confirm the position of these markers. These are the markers:
- start and end of P wave: p_on, p_off
- start and end of the QRS complex: qrs_on, qrs_off
- end of T wave: t_off
The end of the QRS complex (qrs_off) is sometimes referred to as the J-point, i.e. the junction (connection) between the QRS complex and the ST segment.
The program does not evaluate the beginning of the T wave, because it is often difficult to determine where the ST-segment ends and the T-wave begins, especially when it is an ascending (rising) ST-segment, which is smoothly followed by a T-wave. Therefore, the determination of the beginning of the T-wave remains waves upon us.
We correct the position of the markers (red squares) by grabbing them (not their flags) with the left mouse button and adjusting their position. Then we click on Confirm diagnosis, which will be reflected in the fact that the vertical lines of the markers will change their color from blue to red. If we want to adjust their position again later or use cursors to measure, we must first click on Invalidate diagnosis again.
Note:
The wave that appears after the T wave in the image is the P wave of the next cardiac period. Likewise, the wave that appears before the P wave is the T wave from the previous cardiac period. So it is not U-waves, as the plural would lead one to get confused.
Display 3x4 downspout[edit | edit source]
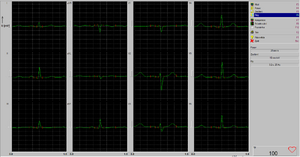
In the 3×4 view of the lead, we can verify that the position of the markers that we set in one lead is also correct in the other leads.
II. lead, table with intervals[edit | edit source]
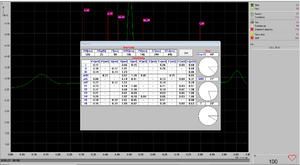
After confirming the diagnosis, we can call up a table with displayed intervals and amplitudes by clicking Show details or F4.
It may happen that, for example, the program did not display some amplitudes correctly or at all. In such cases, we have to measure missing or suspicious values ourselves using cursors.
The table also shows the calculated slopes of the electrical heart axes for the P wave, the QRS complex (i.e. the main electrical heart axis) and for the T wave. We compare the value of the QRS axis calculated by the program with the value we calculated ourselves from the net QRS amplitudes.
Surveying with cursors[edit | edit source]
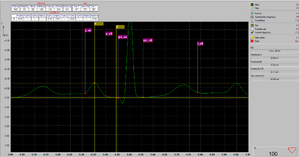
Cursors [A], [B] are used for manual measurement of curves, which can be moved along the curve in the same way as markers. In the right part of the screen, the positions of both cursors on the time and amplitude axes are continuously displayed, as well as their A-B differences.
With the help of cursors, we can measure both amplitude and time differences (length or duration).
P wave amplitude[edit | edit source]
We measure the amplitude of the P wave relative to the isoelectric line. This line theoretically has a value of 0 mV, but in practice it can slightly deviate from this value, i.e. it "floats", e.g. due to various movement artifacts, etc.
Therefore, we derive the actual location of the isoelectric line within one cardiac cycle from the PQ segment, which is the part of the curve from the end of the P wave to the beginning of the Q wave. (Some authors refer to it as the PR segment, meaning that it is the beginning of the QRS complex. Other authors again, instead of the term segment, they use the term section.)
Q wave amplitude[edit | edit source]
We determine the amplitude of the Q wave again from the isoelectric line in the same way as we described for the P wave. In II. Einthoven's lead is usually negative, so we present it with a negative sign.
The amplitude of the S wave is practically zero in our image.
The amplitude of the QRS complex[edit | edit source]
The so-called net amplitude of the R wave, reduced by the sum of the amplitudes of the Q+S waves, is usually used to evaluate the inclination of the electrical cardiac axis of the QRS complex.
The Einthoven equation applies to the amplitudes of all waves in a bipolar connection, resulting directly from the definition of bipolar leads, and it says that the arithmetic sum of the amplitudes of that wave in leads I+III must equal the amplitude of the same wave in lead II. In this way, we can check that we ourselves or the program calculated correctly. If the deviation is greater than a few tenths of mV, we have to find out where the error happened.
ST segment depression or elevation?[edit | edit source]
The ST segment, like the PQ segment, should lie approximately on the isoelectric line, and is thus also drawn on most schematic images. It marks the time when the depolarization of the ventricles has ended (QRS complex) and their repolarization (T wave) has not yet begun, and thus theoretically we should not expect any electrical activity at that time.
In some cases, however, it happens that the beginning of the ST segment (i.e. point J) does not lie on the isoelectric line (or close to it), but is positioned either higher or lower. In such cases, we speak of either elevation or depression of the ST segment. The deviation from the isoelectric line (i.e. from the height of the PQ segment) is then given in mV (respectively in hundredths or tenths of mV).
ST segment inclination[edit | edit source]
Another thing is that the ST segment does not have to be horizontal, but can either rise or fall. In such cases, we speak of an ascending or descending ST segment. There are different opinions on how to evaluate such an inclination of the ST segment, but most authors agree that they measure the rise or fall of the ST segment at a distance of 60 ms after the J point. Such a slope is then given in mV/60 ms or is recalculated according to the rule of direct proportion to a value corresponding to 1 s, and thus given in mV/s.
ST segment length[edit | edit source]
The length of the ST segment refers to the section between the J point and the beginning of the T wave. However, the onset of the T wave is often slow and it is difficult to determine where the T wave begins. In such cases, we usually imagine asymptotes, one of which we mentally place on the ST segment and the other on the leading side of the T wave, and where those asymptotes intersect, we assume the beginning of the T wave. Fortunately, the length of the ST segment itself is not so important for the diagnosis and inaccuracy it does not play such a big role in its determination.
We are more interested in the entire QT interval, i.e. the time that includes the total time from the start of depolarization of the ventricles to the end of their repolarization. Therefore, it is important to correctly determine the end of the T wave. We follow a similar method by imagining the relevant asymptotes between the descending side of the T wave and the subsequent isoelectric line and placing the end of the T wave in their imaginary intersection.
T wave amplitude[edit | edit source]
Printing of ECG waveforms[edit | edit source]
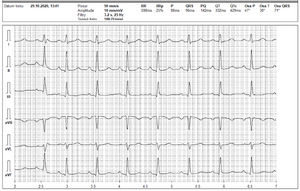
Limb leads[edit | edit source]
After confirming all markers, we can print the ECG curves from all leads. In distance learning, however, after clicking on Print, we choose the option to save as an image, in the highest possible resolution (300 dpi) and in the PNG format, which is more convenient for drawings than the JPG format, which is mainly intended for photos.
Normal paper feed speed is 25 mm/s. However, if we want to measure the curves on paper or on the corresponding image, it is more advantageous to choose a speed of 50 mm/s. In this case, a five-second recording of the limb leads will fit on just one side of A4 paper.
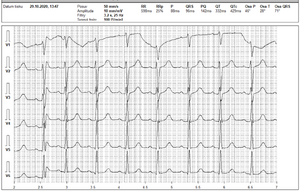
Chest leads[edit | edit source]
The recording of chest leads can then fit on the other side of A4 paper (or in another file with an image).
Subsequently, a table of intervals and amplitudes is saved as the third image.
We will then submit all three images to moodle together with the developed protocol.
Unfortunately, I did not find a way to save the corresponding image in the same style for the Long record, from which it is possible to calculate HRV during inhalation and exhalation. The only option I found is to preview the print and then remove it using the printscreen. Apparently, this is some kind of shortcoming of the BTL-08 Win program. For that reason, we do not require you to attach this record.

