Perimetry (2. LF UK)
(Redirected from Perimetry (Group 6))
Introduction[edit | edit source]
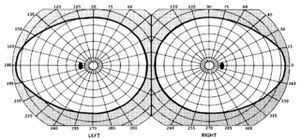
Perimetry is a measurement of the extent of the visual field of the patient. The visual field is the area that one eye is able to see without moving the angle of vision. It is a subjective method of examination, which always needs cooperation of the patient. The normal visual field of human eye is about 60° upwards, 70° downwards 65° towards the nose and 95° outwards. We are able to distinguish between central vision and peripheral vision. As the name says, central vision gives us information about the centre of the visual field of the eye. This area is about one fifth of the whole visual field but over 80% of visual information to the brain comes from this area. The area of peripheral vision surrounds the central vision and provides less sharp an image than the central vision.
The status of visual field gives us useful information, not only about the functioning of the retina, but the condition of the optic nerve and intracranial section of the visual path. It is also important to outline the existence of several types of perimetry: Tangent Perimetry, Goldmann Perimetry, Automated Perimetry (which is based on Goldmann perimetry) and Microperimetry. This paper will focus on automated perimetry as it is the most used type of perimetry in modern hospitals.
Importance to Clinical Medicine[edit | edit source]
Perimetry is mainly used in Ophthalmology which is a branch of medicine that discusses the diseases of the eyeball such as blindness, cataract and glaucoma. In addition, as perimetry is focused on detecting the blind spot of the eye it can also discuss the problem of scotoma that can be a sign of a disease in the eye. Consequently, the most important use of Perimetry is to prevent damage of the optic nerve, central nervous system, visual structures in the brain and also the diseases of the eye which can cause peripheral vision loss and other visual field abnormalities. The most commonly discussed disease in Perimetry is glaucoma that can cause damage to the optic nerve. The Perimetry test is also used to diagnose other more complicated diseases such as macular degeneration, optic glicoma, brain tumor, stroke, central nervous system disorder and the pituitary gland disorder. The results of the Perimetry test can tell in which areas the patient has a problem in his visual field and indicate the areas of the brain or optic nerve that are damaged or about to be damaged or cause of a disease. Glaucoma is linked to increase in the internal pressure in the eye which subsequently degrades the field of vision.
Literature Review[edit | edit source]
Perimetry is a visual field test that measures the subject’s central and peripheral vision. To do this procedure, one eye has to be completely covered as only one eye should be tested at a time. The patient has to look into a a perimeter whilst light flashes from different angles. The computer creates a printout of all the positions of the flashes on the background and determines the field of vision depending on how well the patient reacted to the stimuli. Glaucoma can be indicated if the subject shows to have more than one blind spot as well as degraded areas of their vision.
Perimetry is a particularly well developed field in that it is a reliable means to test an individual’s field of vision. However, this procedure is subjective; it is only able to be as reliable in its results as the subject is able or willing to participate. Only with the subject’s full co-operation can the test be successful. There are problems, for example if a patient partakes in this test several times, he or she will develop a learning curve that will help them subconsciously perform better. For example, a 1996 study examined twenty-five individuals that were just newly detected with glaucomatous eyes. The results of the study determined that “visual field results improved with repeated testing” and these results “were more pronounced peripherally than centrally” (Heijl).
The Equipment[edit | edit source]
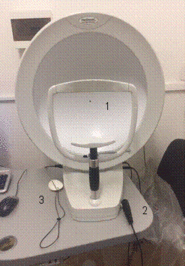
Automated Perimeter MEDMONT M-700.[edit | edit source]
- Fixation point : fixation target at which the patient must fix their vision.
- The response button to use when the patient see the light goes off.
- The eyepatch you will use to cover one eye.
- Chin-Brow Rest - purposed to make patient feel comfortable and fully focus attention on the fixation point.
The patient must press the response button when he sees the light.
The operating software MEDMONT STUDIO[edit | edit source]
This software is an advanced system analysis with many options such as:
- Global Statistics - Allows interpretation of the perimetry results. After the patient finishes the test his results will be compared to the average result of his age group. This tool compares all the points tested and allows us to interpret which areas have defects compared to an average healthy person. This option makes it much more easy for the doctor to identify and problems of abnormalities in the patient's visual field.
- Regression and Histogram analysis - Shows the patterns over time in the form of a diagram or histogram that will display changes over time.
- Full patient history - allows doctor to track the changes in the visual field and identify long term patterns.
Methodology[edit | edit source]
Practical Use of the Perimeter
Procedure:
- Turn on the perimeter table, perimeter, and the computer.
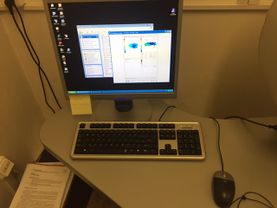
- Using the program Medmont, register one of the group members as a patient (File/New/Patient) and then save the data you entered.
- Run an examination on your patient (File/New/M700N Exam). You will see initial test control window. This window is the representation of the Perimeter. The grey points are the points that will not be tested. The numbers inside the black dots represent the exposure level in decibels and based on the Age Normal Hill of Vision Distribution.
- Select the type o the exam: Glaucoma test. Then choose the eye you want to test and set it in the program settings. After it, click Edit Setting in the Test Menu. From the Stimulus Parameters group select Standard.
- Tick Adaptive Response checkbox, which means that as the test progresses the response time will adapt based on how quickly the patient responds to exposures.
- From the Strategy box select Fast threshold.
- Cover one eye of the patient. Patient should focus his eye on the fixation target
- Start demonstration mode. After patient is familiar with setting press the start button. IMPORTANT: Test will start immediately.
- Patient should follow the light and click for every light he or she follows.
- Surroundings shall not disturb the patient no one shall talk enter or exit the room.
- Dots will change colour:in the course of the test blue – not tested; red - tested, not seen; green – tested, seen; white – completed state.
- After the test, the result status will be displayed on the program.
- Disinfect the eye patch.
After Test You will see such abbreviations: False -ve and False +ve.
False negative:[edit | edit source]
Around every 10th exposure the perimeter will expose one of the completed points of 9dB or dimmer to the patient again (but increasing it by 9dB). This is the reliability test: If the patient will notice this exposure it means that he he really sees this point and has no blindspot there. However, if the exposure remains unnoticed by the patient it means that he had completed the point by guessing rather than by seeing it. Higher false negatives - less reliability. Value of about 33% would indicate low reliability of the patient and the test.
False positive:[edit | edit source]
Considered as even more important indicator of diagnostic accuracy than False -ve, False +ve tests whether patient really sees the light or he just responds to a rhythm of lights (lights appear at the same periods of time. Just as the previous test, False +ve test appears after around every tenth light. The mechanism is a bit different. Instead of testing already completed points, this test is based on using the time slot of the light but not flashing any light at all. Therefore, if the patient simply responds to a rhythm he would press the button while there might not be any light at all. High value of False +ve say 20% indicates low reliability of the patient and test.
Fluctuation Measure[edit | edit source]
Fluctuation measurement adds a further level of confidence by re-testing a number of suspect points and recording the variability of these results. As the test progresses, four spatially dispersed and completed points with the highest defect levels (but not brighter than 3 dB) are chosen for fluctuation testing and are re-tested four times. To ensure four points are chosen, the default threshold defect level is progressively reduced as the test proceeds. When the test concludes, the completed threshold values for these points are examined and their standard deviation (SD) computed.
- 3 or more points with SD > 2.50 - Indicates high severity
- 2 or more points with SD > 2.75 - Indicates medium severity
- 1 or more points with SD > 3.05 - Indicates low severity
Abnormal Points[edit | edit source]
3 Conditions must be satisfied for a point to be considered abnormal:
- It deviates by more than 6 dB from the mean of its neighbours
- The variation within the neighbourhood is reasonable for this test.
- There are an adequate number of neighbour points (i.e. the point is not isolated).
The Button Retest Abnormals will retest those abnormal points. Abnormal points might occur because of loss of attention of the patient during the test or simply not reacting to a light despite seeing it.
Fixation Loss[edit | edit source]
A Fixation Loss control is set automatically. A fixation loss higher than 20 % indicates low patient and low test reliability.
Processing of Data[edit | edit source]
Data processing is based on the information saved in the Medmont Studio. The information comes from the test in several different formats. If the patient had been tesated previously you woudl also be able to see all the results.
- Open the file.
- The toolbar will appear in the upper menu with 3 options (First is for patient's information; Second for test results; Third icon is for regression analysis of the patient's tests.
- Click second icon for test results.
- Open the patient’s file on the left panel. The View Mode controls how the selected exams are displayed. Select the View mode from the View menu. Select Combination View. It displays 4 different clinical views of the same exam allowing deeper and more accurate analysis.
- Display the results as a printing preview, save into folder Praktikum Perimetrie (in Dokumenty folder, shortcut on the desktop) as .jpg or .tiff file format. Print out the result and attach them to the report or upload them to the server.
Evaluation of The Defects[edit | edit source]
- HoV (Hill of Vision). Depending on the eccentricity (distance from the center expressed in degrees) the threshold value changes. Values of the patient's HoV are expressed as the linear slope dB/10° and level in dB corresponding to 3° eccentricity. This means that at 3° eccentricity the patient’s mean threshold was 25.5 dB, and it fell away at 3.5 dB for every 10° of eccentricity. Thus at 20° the HoV level would be 19.55 dB. The calculation might be like this: We need to know dB for 20°, we have value for 3°. The value of dB will be lower at 20° than at 3° as we move further from the centre. The difference between 20° and 3° is 17°. 17/10 = 1.7; we also know slope HoV (3.5 dB/10°). We multiply 3.5 by 1.7: 3.5*1.7 = 5.95dB. Therefore, the difference will be 5.95dB. We know that at 20° it is lower therefore we subtract: 25.5dB - 5.95dB = 19.55dB. That is an example of how you use HoV.
- Overall defect (OD) is the mean difference between the age normal HoV and the mean deviation or patient based HoV. This number is negative if the patient’s HoV is less than the age normal HoV. At the age of 1-45 Low Severity is above -2.6; Medium Severity -3.72; High Severity -4.92. At the age of 46-60 Low Severity is above -2.8; Medium Severity -4.05; High Severity -6.10. At the age greater than 60 Low Severity would be -3.2; Medium Severity -5.95, High Severity --8.91.
- Pattern defect (PD) is based on spatial correlation, and is a measure of the clustering and depth of defects. It is a scaled mean value of the product of a point’s HoV deviation and that of its neighbours. It qualifies the extent to which deviations are spatially correlated or clustered. For example if deviations from the patient’s HoV are distributed more or less randomly throughout the field, then the PD will be small. As deviations tend to cluster, the index will increase, particularly where both the absolute deviations and clustering are high. Pattern Defect of Low Severity is more or equal to 2.8; Medium Severity is more or equal to 5.7; High Severity is more or equal to 8.6.
Conclusion[edit | edit source]
The modern type of perimetry, “White-on-white” perimetry is used in the vast majority of research projects and hospitals, yet many studies have shown that this type of perimetry is simply not sensitive enough. Studies have shown that even after 25-50% loss of ganglion cells perimetry could detect only a mild deficit. Most of the newly developing tests focus on testing different optic pathways – different parts of optic nerve transmitting information about: 1) motion; 2) colour and form: 3) short-wavelengths information. Testing the subset of ganglions (1-3) proved to be a more reliable than white-on-white perimetry for detection of specific diseases (mainly glaucoma). Another development may remove subjectivity from perimetry; in theory we could connect directly to the optic nerve and the corresponding part of the brain to check if the patient really sees the light or they just guess.
References:[edit | edit source]
- Sheppard, John, MD. "Visual Field Test: Learn How the Procedure Is Performed." MedicineNet. Ed. William C. Shiel. N.p., 6 Mar.
2015. Web. 12 Dec. 2016. (Literature Review)
- Johnson, CA, Brandt, JD, Khong, AM, and Adams, AJ.
"Low-, Medium-, and High-risk Ocular Hypertensive Eyes." Archives of Ophthalmology (Chicago, Ill. : 1960). U.S. National Library of Medicine, Jan. 1995. Web. 12 Dec. 2016. (Literature Review)
- PhD, Anders Heijl MD. "The Effect of Perimetric
Experience in Patients With Glaucoma." The JAMA Network. JAMA Ophthalmology, 01 Jan. 1996. Web. 12 Dec. 2016. (Literature Review)
- Recent Developments in Perimetry: Test Stimuli and
Procedures; Article in Clinical and Experimental Optometry 2005; Allison M McKendrick; MScOptom PhD; School of Psychology, University of Western Australia; P. 73; 74; 75. (2 links are given for the same information) file:///C:/Users/User/Downloads/Recent_developments_in_perimetry_Test_stimuli_and_.pdf
http://onlinelibrary.wiley.com/doi/10.1111/j.1444-0938.2005.tb06671.x/epdf (Conclusion)
- Glaucoma Today; Title: The Next Generation in Perimetry; By
Chris A. Johnson, PhD, DSc; November 2015; Volume 13; http://glaucomatoday.com/2015/12/the-next-generation-in-perimetry (Conclusion)
- HealthLine Website; izual Field Exam;Wrtten by: Janelle Martel; Medically Review by Seven Kim; 6th January 2016 http://www.healthline.com/health/visual-field#AutomatedPerimetryTest4 (Importance to clinical medicine)
- AllAboutVision Website; Visual Field Testing; Written by Marilyn Haddrill; Reviewed by Charles Slonim, MD; http://www.allaboutvision.com/eye-exam/visual-field.htm (Importance to clinical medicine)
- Glaucoma Research Foundation Website; Why do I need a visual test? Written by Anna C. Momont, MD and Richard P. Mills, MD, MPH; Last Reviewed: Spetember 2014i
http://www.glaucoma.org/treatment/why-do-i-need-a-visual-field-test.php (Importance to clinical medicine)


