Energy metabolism and disorders
processes in living cells take place with the transformation of energy. The energy of the chemical bond between carbon and carbon (–C – C–) and between carbon and hydrogen (–C – H–) is converted into other forms. Energy transformation in cells from nutrients received from the environment can be divided into 3 phases:
- energy recovery by oxidation of nutrients
- conversion of this energy into a bioavailable form of high-energy phosphate bonds ATP
- utilization of ATP phosphate bond energy for energy-intensive processes
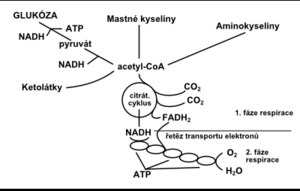
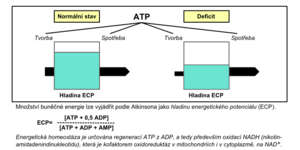
The first two phases of energy transformation are part of the so-called cellular respiration (Fig. 1). The cell obtains energy mainly by oxidative phosphorylation, which takes place in the respiratory chain in mitochondria . Energy production during anaerobic glycolysis is less efficient but equally important. If the body's life processes are to be maintained, the production of adenosine triphosphate (ATP), which is the main immediate energy supplier, must be balanced against its needs; if this is not the case, an energy deficit arises (Fig. 2).
Energy metabolism disorders[edit | edit source]
The causes of disorders of energy metabolism can be divided into three major groups:
- Disorders caused by imbalance of energy supply and expenditure (long-term starvation, anorexia nervosa , malnutrition , marasmus , malabsorption , overeating)
- Disorders in intermediate metabolism (endocrinopathy such as hyperthyroidism , essential obesity , tumor cachexia, multiple organ dysfunction)
- Disorders in cellular respiration (tissue hypoxia , substances causing oxidation to separate from phosphorylation, cyanide or CO poisoning )
The causes can, of course, be combined.
Examination of the energy potential of the liver cell[edit | edit source]
It is not possible to measure the NAD + / NADH (redox-potential) ratio directly in cells (mitochondria). Ozawa (1983) came up with a method of indirectly measuring the intramitochondrial redox potential based on the mutual ratio of the oxidation-reduction reaction:
The condition is to measure this ratio in the arterial blood and also in the absence of conditions where overproduction of ketone bodies (ketosis) occurs. Ozawa (1992) called this examination the determination of the ratio of ketone bodies in arterial blood ( AKBR - A rterial K etone B ody R atio) and showed that it reflects the intramitochondral ratio NAD + / NADH and thus ATP / ADP, especially in hepatocytes . Hepatic cell damage ( necrosis ) with all its consequences (cellular energy deficit) and manifestations of disorders of hepatocyte metabolic functions
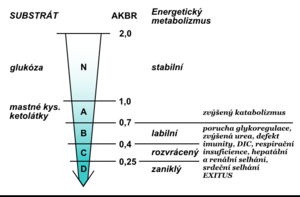
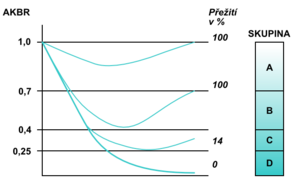
At energy balance, the AKBR value is> 1.0 (maximum can be 2.0). In healthy individuals, it is achieved by administering 75 g of glucose orally or by administering 15 g intravenously. Ozawa called this value the oxidation maximum (Oxi-Max). If the body gains energy mainly through the oxidation of fatty acids , the AKBR decreases to 0.7. A further decline below this value reflects a gradual energy deficit. The critical but still reversible situation is a decrease to 0.4; a reduction below 0.25 is no longer incompatible with life (Fig. 4). Monitoring the AKBR trend can be an objective prognostic indicator of the clinical condition of critically ill patients (Fig. 5).
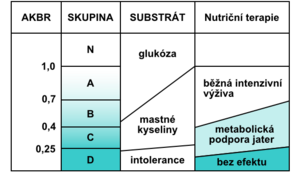
With a decrease in AKBR below 0.4, there is a complete inhibition of gluconeogenesis , a significant increase in lactate , a decrease in the cytoplasmic NAD + / NADH ratio, and a decrease in mitochondrial NAD + / NADH begins with multiple organ dysfunction. In the laboratory examination we find manifestations of glucose intolerance (hyperglycemia in exogenous administration) unresponsive to the current application of insulin , decreased levels of branched chain amino acids, pathological Fisher index, increased catabolic index, negative nitrogen balance, pathological difference between calculated and measured osmolality , bilirubinemia, , ALT , hyperammonemia, increase in creatinine and LD, positive tests for the presence of disseminated intravascular coagulopathy (antithrombin III, Quick's test , aPTT , factor II, V, VII, IX, X, antiplasmin), positive tests for immune deficiency, decreased proteosynthesis (low prealbumin. albumin , transferrin). The value of AKBR is also very useful for the proper management of nutritional therapy in critically ill patients. It informs about which substrate is mainly used by the cells to cover the required energy (Fig. 6).
The most important clinical situations in which it is appropriate to investigate the AKBR:
- early detection of impending multiorgan dysfunction ,
- monitoring of severe liver procedures (resection, transplantation),
- monitoring of critically ill patients (hemorrhagic shock, abdominal sepsis, polytraumas ),
- monitoring the adequacy of artificial nutrition.
Energy balance[edit | edit source]
The intake and expenditure of energy in the body must be balanced so that there is no weight gain or loss. The energy content of food and human energy reserves are summarized in the table:
| component | Energy content (kcal / g) | it is stored in the tissue | percentage in the given tissue | mass |
|---|---|---|---|---|
| Carbohydrates | 4 | Liver glycogen | 0.2% | 0.08 kg |
| Muscle glycogen | 0.4% | 0.15 kg | ||
| Proteins | 4 | Proteins (not the right stock) | 14.5% | 6 kg |
| Lipids | 9 | Fat | 85% | 15 kg |
| Alcohol | 7 |
Basal metabolic rate (BMR) is a measure of the energy needed to maintain basic vital functions at rest in bed. On average, this is 24 kcal / day / kg body weight (eg for a 70 kg person 24 × 70 = 1680). A more detailed calculation will allow:
- Harris-Benedict formula
- BMR women = 655 + (9.6 × weight in kg) + (1.8 × height in cm) - (4.7 × age in years)
- BMR men = 66 + (13.7 × weight) + (5 × height) - (6.8 × age)
- Owen's formula
- BMR women = 795 + (7.18 × weight)
- BMR men = 879 + (10.2 × weight)
When increasing physical activity, it is necessary to multiply this basic need (expenditure) of energy by the activity factor:
| Degree of activity | activity factor / hour | converted to kcal | |
|---|---|---|---|
| Peace | sleep, calm in bed | 1.0 | 1680 |
| Very mild | sitting and standing activity, driving a car, administrative work, cooking, playing cards, making music | 1.5 | 2520 |
| Mild | walking with a capacity of 4–4.8 km / h, work in the garage, in the restaurant, house cleaning, golf, table tennis | 2.5 | 4200 |
| Medium | walking with an output of 5.6-6.4 km / h, carrying costs, cycling, skiing, tennis, dancing | 5.0 | 8400 |
| Heavy | uphill walking with cargo, tree felling, mountaineering, hard manual labor, basketball, football, hockey | 7.0 | 11 760 |
Oxygen deficiency disorders[edit | edit source]
In the absence of oxygen in the mitochondria, the regeneration of ATP from ADP by oxidative phosphorylation as the main source of energy for aerobic organisms is prevented. Anaerobic glycolysis, which tries to cover the most necessary cellular energy requirements, will only take a very short time (normally a few tens of seconds to several minutes). Accumulation of the final metabolite of anaerobic glycolysis - lactate - will increase the proton concentration (H +) to such an extent that cellular metabolism, resulting in cell death, is blocked (not all tissues are affected equally quickly). Understanding the basic mechanisms that govern the state of oxygen in the body is very important for a correct diagnosis and thus adequate treatment (especially patients in critical condition with insufficient oxygen supply for cellular energy metabolism). According to Siggaard-Andersen, critical oxygen delivery depends on the cause of the low supply. E.g. if the oxygen supply is halved and this is due to a reduction in cardiac output by half, then the partial pressure of oxygen (pO 2 ) in the mixed venous blood drops to about 3.5 kPa. However, if it is caused by a half-decrease in the concentration of total oxygen in the arterial blood, then pO 2in mixed venous blood it drops to about 2.2 kPa. Oxygen tension in mixed venous blood is very closely related to the average O 2 tension at the end of the capillary bed, which determines the diffusion gradient for O 2 from erythrocytes to mitochondria. For this reason, the critical value of pO 2 in mixed venous blood has a greater significance than the critical oxygen supply.
Pathobiochemistry of O 2 metabolism[edit | edit source]
Oxidative metabolism in humans is influenced by three basic factors:
- Convection transport of O 2 from the ambient air into the blood capillaries of the relevant tissues using hemoglobin and erythrocytes as vehicles;
- Diffusion of O 2 from erythrocytes in capillaries into cell mitochondria;
- Reduction of oxygen in mitochondria through the transport of electrons from reductants, ie carbohydrates, fats or proteins (electron transport chain consisting of cytochromes, flavoproteins and nicotinamide nucleotides).
Oxygen convection[edit | edit source]
Substance change (oxygen rate) is the flow of oxygen through the bloodstream , ie oxygen supply (nO 2 flow) is the product of cardiac output per minute (VB flow) and the concentration of total oxygen in the arterial blood (ctO 2 A):
The substance change in the extraction of oxygen from the blood (nO 2 extr) is the product of the cardiac output and the arteriovenous difference in the concentration of total oxygen:
Oxygen diffusion[edit | edit source]
The substance change of oxygen diffusion from hemoglobin to cytochrome oxidase , ie cytochrome aa 3 (n.O2 diff) can be calculated as the product of the diffusion coefficient (δO 2 ), the solubility coefficient O 2 (αO 2 ), the total diffusion area of the capillary endothelium (A) and oxygen tension gradient (dpO 2 / dl):
The product of the diffusion coefficient and the solubility coefficient is the permeability coefficient ( kappa O 2 ). The ratio between the diffusion area and the diffusion path increases in the muscle during activity (work) as the number of flow capillaries increases. This ratio decreases when edematous tissue leakage occurs or during microembolization. The oxygen tension gradient is the difference in mean oxygen tension (pO 2 cap - pO 2 cell) divided by the mean distance between erythrocytes and mitochondria. The limiting factor for oxygen diffusion is the O 2 tension at the end of the capillary bed.
The oxygen tension of the mixed venous blood is usually equal to the O 2 tension at the end of the capillary; however, A-V short-circuits must be taken into account. When e.g. arteriovenous shunts in the skin or else increase by 10% of the total cardiac output, then the O 2 mixed venous blood tension is about 0.3 kPa higher than the mean O 2 tension at the end of the capillaries.
Oxygen reduction[edit | edit source]
O 2 reduction in mitochondria takes place as a zero-order reaction, which depends on energy requirements rather than oxygen availability. Hyperbasic oxygen, for example, does not increase oxygen consumption. In other words, the amount of oxygen diffusion (nO 2 diff) and the amount of oxygen extraction (NO 2 extr) are adjusted to match the amount of oxygen reduction (nO 2 red). This is regulated by the ATP / ADP ratio. More than 90% of oxygen reduction takes place in mitochondria, where the reduction of one molecule is O 2During oxidative phosphorylation, six ATP molecules are recovered from ADP. In some tissues, such as brown fat in some mammals, oxygen reduction is only associated with heat production without the formation of ATP. Some toxic agents or drugs break down oxidative phosphorylation and ATP is not formed during O 2 reduction . The amount of energy generated during O 2 reduction is about 450 kJ / mol ; it depends on the nature of the metabolized source (carbohydrates, fats or proteins). The useful chemical energy in the hydrolysis of ATP is about 50 kJ / mol . The reduction of O 2 starts according to the first-order reaction kinetics according to the concentration of pO 2 in the cell cytosol, as soon as its value drops by 0.1 kPa below the critical limit. Normal average tension2 in the cell is 1.6 kPa with variations according to tissue type. Toxic inhibition of cytochromes increases the critical value of cellular pO 2 . Cyanide poisoning can block oxygen reduction completely.
The normal average value of pO 2 at the end of the capillary bed is about 5.0 kPa. The average difference between pO2 in erythrocytes and in mitochondria is about 3.4 kPa. Breathing higher oxygen content increases pO 2 at the end of the capillary as in the cell, so the difference and the rate of diffusion remain the same. When pO 2 decreases at the end of the capillary, e.g. for the decrease of arterial pO 2 , the cellular pO 2 decreases by the same value and also the diffusion flow remain unchanged until the value of pO 2 at the end of the capillary reaches a critical value, ie 3.5 kPa and the cellular pO 2 decreases to 0.1 kPa . The continuing decrease in pO 2 at the end of the capillary causes a decrease in O reduction2 in mitochondria. When e.g. the pO 2 at the end of the capillary drops to 1.7 kPa, then the cellular pO 2 drops to 0.05 kPa; the rate of O 2 diffusion is then halved, which predetermines the rate of O 2 reduction , which is also halved.
Relationship between oxygen reduction rate and pO 2 in mixed venous blood[edit | edit source]
Primary changes in mixed venous blood pO 2[edit | edit source]
When venous pO 2 rises, e.g. when inhaled rich in O 2 , the rate of O 2 consumption remains constant. However, if the increase in venous pO 2 is due to an increase in cardiac output, the rate of O 2 consumption increases due to increased cardiac output . As venous pO 2 decreases, the rate of O 2 consumption usually remains unchanged until a critical value ( 3.5 kPa ) is reached. Further reduction leads to a decrease in O 2 consumption .
At normal oxygen levels and normal O 2 consumption , doubling the cardiac output will increase pO 2 in mixed venous blood from 5.0 kPa to 6.6 kPa; if the cardiac output drops by half, pO 2 drops to about 3.5 kPa. The change in oxygen extraction from arterial blood causes the same change in pO 2 of mixed venous blood, and thus when the difference in arteriovenous O 2 concentration reaches 2.3 mmol / l, pO 2 in mixed venous blood is practically equal to the extraction tension of arterial oxygen .
Changes in the ratio between the average oxygen diffusion area and the diffusion distance[edit | edit source]
The critical pO 2 value of mixed venous blood and the oxygen consumption curve depend on the diffusion area / diffusion distance ratio. The increased ratio caused by the increase in the number of flow capillaries shifts the consumption curve to the left (see nomogram) and at the same time reduces the critical value of mixed venous pO 2 . Decreasing this ratio shifts the curve to the right and increases the critical value of pvO 2 . Also, increasing the percentage of arteriovenous shunts shifts the curve to the right.
Pathological conditions in oxygen metabolism[edit | edit source]
Tissue oxygen deficiency - tissue hypoxia - should be identified in time, correctly classified and, if possible, quantified. Tissue hypoxia is a situation where the production of oxidative energy is insufficient, when the production of energy from anaerobic glycolysis increases, which causes lactic acidosis and thus disorders in cellular metabolism.
Causes of tissue hypoxia[edit | edit source]
According to Siggaard-Andersen, the causes of hypoxia can be divided into eight groups:
- Decreased cardiac output ( VB ) causes ischemic hypoxia.
- Decreased oxygen tension ( px ) causes hypoxia from low extractivity.
- Increased arteriovenous shunts ( fav– ) (= short-circuit hypoxia).
- Increase in mean oxygen diffusion path ( l diffus ) (= dysperfusion hypoxia).
- Reduction of the diffusion area in the endothelium of capillaries for O 2 ( A diffus ) (= dysperfusion hypoxia).
- Inhibition of cytochromes by toxic substances ( cyt. Inhibition ) (= histotoxic hypoxia).
- Reduced ratio between ATP production and O 2 reduction (= hypoxia from oxidative phosphorylation dissociation).
- Increased energy metabolism (hypermetabolic hypoxia).
The causes of low px (group 2) are:
- low arterial pO 2 (= hypoxemic hypoxia),
- low effective hemoglobin concentration (= anemic hypoxia),
- low p 50 (= hypoxia from high affinity Hemoglobin for O 2 ),
Note: Quantitative measurement of these causes of hypoxia is only possible with the first two, ie measurements of cardiac output and arterial blood oxygen pressure. Other causes must be evaluated clinically.
Tissue hypoxia classes[edit | edit source]
Based on the effect of the above-mentioned factors on the pO 2 value in mixed venous blood and on the rate of oxygen consumption, the 8 causes of hypoxia can be classified into 3 classes.[edit | edit source]
- Class A
The primary disorder is a reduction in pO 2 in mixed venous blood without changes in the optimal rate of oxygen consumption. When pO 2 falls below a critical value, the rate of O 2 consumption also decreases , leading to an increase in anaerobic glycolysis and thus to lactic acidosis. The cause may be a low cardiac output per minute or a low oxygen extraction tension. The low value of one of these components can be compensated by a corresponding change in the other component. The therapeutic goal is to increase the pO 2 v- above the critical value in order to ensure the optimal rate of oxygen consumption.
- Class B
The primary disorder is an increase in the critical value of pO 2 in mixed venous blood without a change in optimal O 2 consumption . When the critical value of mixed venous pO 2 rises above the normal value (ie 5 kPa), the rate of oxygen consumption decreases and mixed venous pO 2 increases without increasing cardiac output or oxygen extraction tension (as a compensatory mechanism). A decrease in the change in oxygen consumption below the optimal limit results in anaerobic glycolysis with subsequent lactic acidosis. The cause of class B hypoxia is "dysperfusion" caused by increased arteriovenous shunts, interstitial edemawith an increase in the diffusion distance required to transfer oxygen from the hemoglobin to the mitochondria and a decrease in the total diffusion area of the capillary endothelium. Histotoxic hypoxia caused by cytochrome inhibition may also cause a primary increase in the critical value of pO 2 in mixed venous blood as the critical pO 2 of the cell increases. The therapeutic goal , in addition to causal therapy, is to increase the mixed venous pO 2 to a supra-normal value.
- Class C
The primary disorder is an increase in basal oxygen requirements with a secondary increase in the critical value of pO 2 in mixed venous blood. If cardiac output is unchanged, mixed venous pO 2 decreases as a result of an increase in oxygen consumption. Class C hypoxia is caused by increased metabolism due to the cleavage of oxidative phosphorylation of ATP and an increased need for ATP. The therapeutic goal is to increase the mixed venous pO 2 to a supra-normal value in order to ensure a diffuse oxygen flow in parallel with the increased O 2 consumption .
| CLASS | |||||
| optimal change in O 2 consumption | critical mixed venous pO 2 | current mixed venous pO 2 | Hypoxia type | Primary disorder | |
| AND | normal | normal | reduced | ischemic | declining VB |
| low extractivity | falling px | ||||
| hypoxemic | decreases pO 2 | ||||
| anemic | Hemoglobin concentration decreases | ||||
| from high affinity | decreases p 50 | ||||
| B | normal | increased | increased | short circuit | rising fav– |
| dysperfusion | r diffus and A diffus rises | ||||
| histotoxic | cytochrome inhibition | ||||
| C | increased | increased | reduced | dissociation of oxidative phosphorylation | the amount of ATP decreases |
| hypermetabolic | |||||
Links[edit | edit source]
https://www.wikiskripta.eu/index.php?curid=28942
Related Articles[edit | edit source]
- Energy equivalent
- Cell energy system

