Doppler imaging
Doppler imaging is a method of receiving and processing data obtained during Doppler sonography. In general, we can divide them into spectral and color, but there are also other methods that focus on working with specific data of received ultrasound.
Spectral recording[edit | edit source]
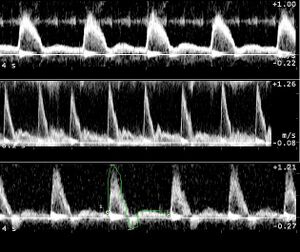
It is used to record the spectrum at the speed of a certain sampling volume in time. The vertical axis of the graph (the so-called Doppler spectrum) shows the Doppler shift, or the speed that the device calculates from the given values of the insonance angle, the speed of sound propagation in the environment, the frequency of the transmitted sound and the measured value of the received frequency. If the monitored object is moving towards the probe, its velocity values are displayed above the horizontal (time) axis, if it is moving away from the probe, its velocity is recorded below the axis. Since the Blood (individual Erythrocytes) does not always move at the same speed in the diameter of the vessel, we measure several speeds at one moment. In the graph, this fact corresponds to the amplification of the curve in a strip of varying width instead of a thin line.
The advantage of spectral imaginng is the accurate quantification of the output data.
Color Doppler recording (BD)[edit | edit source]
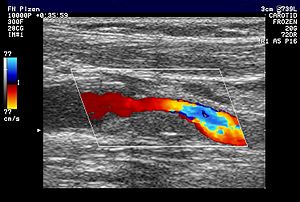
Color Doppler recording, also known as „color doppler“, is a method of color coding the flow. The floe rate is displayed in red, if the movement is towards the probe, or in blue if the movement is away from the probe(it is worth noting that when mapping blood flow in vessels, these colors do not represent the differentiation of venous and arterial blood). Color brightness is a function of flow rate – the faster the liquid moves, the brighter the shade of that color is. Turbulent flow is shown in green.
Color Doppler Flow Mapping (CFM, CDI)[edit | edit source]
(Color Flow Mapping = CFM, Color Doppler Imaging = CDI)
Color Doppler flow mapping shows us two superimposed, integrated, images on the monitor (this is a Duplex display method). It has both characteristics as a B image in gray tones showing the morphology of the investigated area (ultrasound image) and as a color image that represents the measured frequency shift of reflected or scattered waves and in the form of color indicates the direction and speed of the flow.
The main advantage of this method is the simplification of orientation in vascular structures. Thanks to the color differences, we can easily distinguish the vessels through which Blood flows and other tissue spaces.
The disadvantage is the impossibility of displaying complete information about the flow – the average flow speed and flow direction are displayed only.
Color energy doppler (CDE, ED, CPA, CAI)[edit | edit source]
(Colour Doppler Energy = CDE, Energy Doppler = ED, Colour Power Angio = CPA, Colour Amplitude Imaging = CAI, Color Coding of Flow Energy, Doppler Power Mode, Power Mapping)
This method displays the energy that is generated on moving structures. The color shade of only one color (most often orange) in each pixel corresponds to the intensity of the reflected sound wave, i.e. actually the density of erythrocytes. A higher density of moving objects is normally expressed by a lighter shade, a lower density by a darker shade.
The main disadvantage of this display is that we cannot simultaneously read information about the speed or direction of blood flow. We can circumvent this shortcoming by using the Directional power Doppler method or by combining it with spectral imaging, in the so-called triplex mode. Furthermore, the method is sensitive to motion artifacts and that is why we have to choose a location where these disturbing elements can be avoided.
The great advantages are the independence of flow velocity and Doppler angle. Therefore, energy doppler is used to image small vessels, in which blood does not flow as quickly, and is also suitable for imaging organ perfusion. There is also no aliasing effect and noise is suppressed.
Tissue Doppler imaging (TDI)[edit | edit source]
(Tissue Doppler Imaging = TDI)
The color display of tissue movements makes it possible to display in color the speed and direction of even slower movements (1-10 mm/s) than, for example, blood flow in blood vessels.
It is mainly used in cardiology (movements of the heart wall), then in angiology, where it is used to evaluate the elastic properties of vessel walls, or in orthopedics, where it is expected to be used in assessing muscle contraction and tendon movements.
Tissue Harmonic Imaging (THI)[edit | edit source]


A modification of contrast-enhanced ultrasound examination, called "harmonic imaging", aims to eliminate motion artifacts, which make up to 20% of patients difficult to examine with conventional two-dimensional ultrasound imaging.
Contrast agents are used to increase the intensity of the Doppler signal, in this case one that contains gas bubbles of several micrometres in size. When interacting with ultrasonic waves, these bubbles resonate and emit waves returning back to the source in the direction of reflection. They do not emit waves of a single frequency, but also of its higher harmonic multiples. If the receiver is set so that it does not process reflections of the fundamental frequency, but only waves of the expected harmonic frequency, the resulting information will only tell about structures containing microbubbles (motion artifacts in the fundamental frequency will thus be suppressed).
The advantage of the method is shortening the examination time of patients who are difficult to examine with ultrasound and increasing the contrast while maintaining the distinguishing ability, which leads to easier interpretation of the results.
Measurement parameters[edit | edit source]
Pulse Repetition Frequency (PRF)[edit | edit source]
(PRF, Doppler scale, sample frequency)
It indicates the number of pulses that the device emits and receives in one second (so we only talk about PRF for pulsed doppler PW). Shannon's sampling theorem must be observed and the sampling frequency should be set to at least twice the highest sample frequency. The limitation of the highest measurable speed at a given PRF is often referred to as the Nyquist limit. The Nyquist frequency corresponds to the value of the Doppler shift frequency (= speed), which we do not yet perceive in a distorted way at the given PRF
- Aliasing:
- is a representation of those Doppler shifts that lie above the Nyquist frequency, , on the opposite side of the zero level. This corresponds to unexpected signals on the opposite side of the spectral display and the sudden transition from the brightest red to the brightest blue in color doppler. It can be suppressed by changing the PRF or shifting the zero level.
- Stream separation:
- can be confused in color display with aliasing. It is also a transition from red to blue, but in this case it is a gradual transition, through colors corresponding to small velocities, and shows the actual bifurcation of the blood flow.
Doppler Cursor[edit | edit source]
(sampling volume, Doppler gate length)
is a defined area from which the device detects the signal, in practice this corresponds to the diameter of the given vessel. We can set it up in the easiest way in the duplex mode, which combines the color Doppler display and the B display of classic ultrasound.
A larger sampling volume range than a given vessel also displays surrounding tissues that may interfere with the signal. When setting a smaller range, information about the course of the flow in the entire vessel is not available and the signal needs to be amplified, so noise is created.
Doppler angle[edit | edit source]
is an acute angle that forms the direction of the transmitted ultrasound and the direction of the flow of the scanned object. Theoretically, the best results should be obtained at an angle of 0°, but this situation hardly occurs in practice. Conversely, at an angle of 90°, we cannot measure any value (in practice, due to the non-uniformity of the propagation direction of all transmitted rays, it is obtained, but it does not have a sufficient telling value).
We have to choose the Doppler angle so that it matches reality as much as possible. At small values of the angle, the resulting speed will not change much if we make a small mistake. However, at values of 60° and above, even a small error can distort the result by tens of percent. Again, the Doppler angle is easier to choose if duplex mode is available.
When using linear probes, the transmitted sound can also be shifted laterally in order to reduce the doppler angle.
Filter[edit | edit source]
(wall filtr, thump filtr)
serves to remove unwanted signals from the resulting image. Ultrasound device also receives information about the movement of surrounding tissues, which are caused by, for example, Breathing or pulsation. These movements correspond to very low Doppler shifts, which can be removed from the result if we set the lower limit of the received frequencies. The lower limit can range from 25 to 1500 Hz, values of 50 to 300 Hz are mainly usable in practice.
When removing low-frequency signals, we can also lose some important data, for example information about slow-flowing veins. Some modern devices are able to deal with this deficiency and eliminate those frequencies that correspond only to tissue movements in a diagnostically unattractive environment (Dynamic Filter, Dynamic Motion Differentiation).
Additional parameters[edit | edit source]
- Color recording priority
- determines the place in the resulting image that will be colored according to the received signals. For Blood (which appears black in ultrasound, it is anechoic) the gray level of the pixel will be selected, to which a color record will be assigned. However, this method can prevent staining of slow flows and small vessels (they may not always be filled with blood).
- Color recording sensitivity
- it increases the number of transmitted pulses per unit area, but at the same time slows down the image frequency.
- Color recording persistence
- affects whether the resulting color of the image will be more variable or calculated from the average of several successive values of the received signals. When the persistence is reduced , we have a telling record of the flow variability, while an increased value makes it possible to get rid of the noise.
- Output power
- The amount of energy that is sent to the investigated area is called the output power. If it is excessively increased, there may be a risk of damage to the organism.
- Income amplification
- or the gain of the receiver is characteristic of the processing of the received signal. By increasing this value, we brighten the output graph, but also increase the noise.
- Ultrasound frequency
- it is the frequency of the transmitted wave. At the same time, sound with a higher frequency is more easily absorbed by tissue, so it does not penetrate as deeply as sound with a lower frequency.
- Spectrum inversion
- is used to rotate the spectral display graph around the zero level axis. In this case, flows towards the probe are displayed below the axis and flows away from the probe above the axis.
Links[edit | edit source]
Related Articles[edit | edit source]
- Doppler sonography/medical applications • Doppler sonography
- Doppler echocardiography • Transcranial Doppler • Fetal Dopplerometry • Doppler flowmeter
- Doppler Effect
External links[edit | edit source]
References[edit | edit source]
- ROSINA, Jozef. Medical Biophysics. 1. edition. Praha : Manus, 2000. vol. 0. ISBN 80-902318-5-3.
- ELIÁŠ, Pavel – ŽIŽKA, Jan. Doppler ultrasonography. 1. edition. Hradec Králové : Nucleus, 1998. ISBN 80-901753-5-X.
- NIEDERLE, Petr. Dopplerovská echokardiografie. 1. edition. Praha : Maxdorf, [1996]. ISBN 80-85800-41-1.
- HRAZDIRA, Ivo. Úvod do ultrasonografie : v otázkách a odpovědích pro studenty lékařské fakulty [online]. ©2008. [cit. 2013-11-17]. <http://www.med.muni.cz/dokumenty/pdf/uvod_do_ultrasonografie1.pdf>.
- BAJGAR, Robert. Dopplerovské ultrazvukové metody [online]. [cit. 2013-11-17]. <http://ulb.upol.cz/praktikum/doppnav.pdf>.


