3.1 EEG
Electroencephalography (EEG) is the recording of electrical activity along the scalp. EEG refers to the recording of the brain's spontaneous electrical activity over a short period of time, usually 20–40 minutes, as recorded from multiple electrodes placed on the scalp. In neurology, the main diagnostic application of EEG is in the case of epilepsy. Next clinical use of EEG is in the diagnosis of coma, encephalopathy, and brain death. Also the EEG can be used for studies of sleep and sleep disorders. EEG used to be a first-line method for the diagnosis of tumors, stroke and other focal brain disorders, but this use has decreased with the advent of anatomical imaging techniques with high (<1 mm) spatial resolution such as MRI and CT.
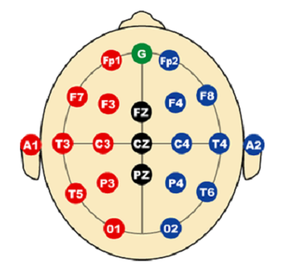
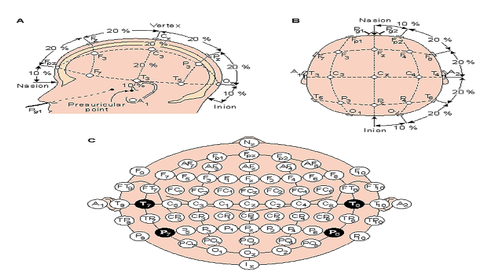
Electrode locations and names are specified by the International “10/20" system (Figure 3.2). This system is based on the relationship between the location of an electrode and the underlying area of cerebral cortex. The "10" and "20" refer to the fact that the actual distances between adjacent electrodes are either 10% or 20% of the total front-back or right-left distance of the skull. In most clinical applications, 19 recording electrodes (plus ground and system reference) are used.
Figure 3.2: System „10/20“- placement and signing of electrodes
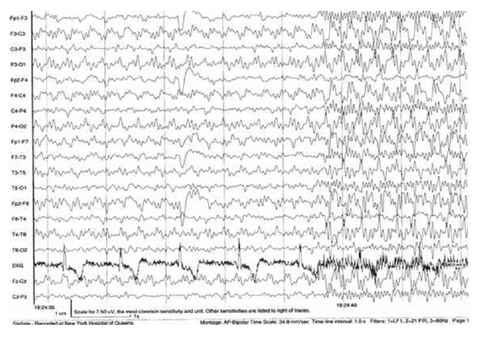
Each electrode is connected to one input of a differential amplifier (one amplifier per pair of electrodes); a common system reference electrode is connected to the other input of each differential amplifier. These amplifiers amplify the voltage between the active electrode and the reference electrode (typically 1,000–100,000 times, this is because the EEG signal is in microvolts range). These signals are usually filtered because useful frequencies are in range 1 – 30 Hz but there are also more high frequencies in signals. Recording of EEG signal is shown on Figure 3.3.
Figure 3.3: EEG recording.
These recorded signals are then processed by special software. Also this data can be used for 3D brain activity mapping. In EEG records several important wave patterns (Figure 3.4) are identified.
Alpha waves have a frequency range from 8 Hz to 12 Hz. It is associated with closing of the eyes, relaxation and attenuates with eye opening or mental exertion.
Beta waves have a frequency range from 12 Hz to about 30 Hz. Beta activity is closely linked to motor behaviour and is generally attenuated during active movements. Low amplitude beta waves with multiple and varying frequencies is often associated with active, busy or anxious thinking and active concentration. Rhythmic beta wave with a dominant set of frequencies is associated with various pathologies and drug effects, especially benzodiazepines.
Delta waves have a frequency range up to 4 Hz. It tends to be the highest in amplitude and is the slowest waves. It is seen normally in adults in slow wave sleep.
Theta waves have a frequency range from 4 Hz to 7 Hz. Theta is seen normally in young children. It may be seen in drowsiness or arousal in older children and adults; it can also be seen in meditation. Excess theta waves represent abnormal activity. It can be seen as a focal disturbance in subcortical lesions, metabolic encephalopathy, deep midline disorders or some instances of hydrocephalus. On the contrary this range has been associated with reports of relaxed, meditative, and creative states.
Gamma waves have a frequency range of approximately 30–100 Hz. Gamma rhythms are thought to represent binding of different populations of neurons together into a network for the purpose of carrying out a certain cognitive or motor function.
Clinically significant EEG frequency bands:
Figure 3.4: An example of EEG frequency bands


