File:Wavestats.svg
From WikiLectures

Size of this PNG preview of this SVG file: 741 × 336 pixels. Other resolutions: 320 × 145 pixels | 640 × 290 pixels | 1,024 × 464 pixels | 1,280 × 580 pixels | 2,560 × 1,161 pixels.
Original file (SVG file, nominally 741 × 336 pixels, file size: 19 KB)
Summary
| Description |
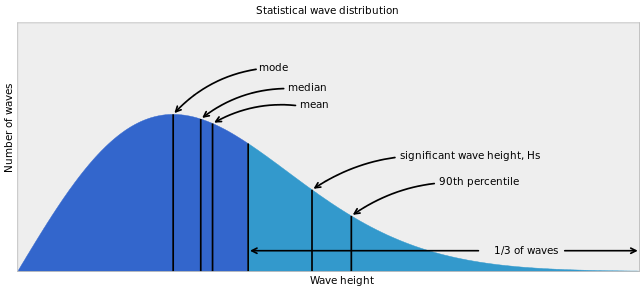
English: Wave Statistics |
| Source |
|
| Author | NOAA |
| SVG development | This plot was created with Matplotlib/Adobe. This plot uses embedded text that can be easily translated using a text editor. |
| Source code | Python codeimport numpy as np
import scipy.stats
import matplotlib.pyplot as plt
maxx = 8.0
rc('text.latex', preamble='\usepackage{sfmath}')
rc('text', usetex=True)
rc('font', family='sans-serif')
x = np.arange(0,maxx,0.01)
rayl = scipy.stats.rayleigh(loc=0,scale=2)
p = rayl.pdf(x)
x67 = rayl.ppf(2/3.0)
idx0_67 = x < x67
maxidx = np.max(np.where(idx0_67)[0])
idx67_0 = x >= x67
idx67_0[maxidx] = True
fig = plt.figure(figsize=(10,4))
ax = fig.add_axes([0,0,1,1],frameon=True)
ax.set_ylim(0,0.48)
ax.set_xlim(0, maxx)
ax.fill_between(x[idx0_67],np.zeros(p.shape)[idx0_67], p[idx0_67], alpha=0.5, color=(0.2,0.4,0.8))
ax.fill_between(x[idx67_0],np.zeros(p.shape)[idx67_0], p[idx67_0], alpha=0.5, color=(0.2,0.6,0.8))
ax.vlines(x67, 0, rayl.pdf(x67), linewidth=2, alpha=0.5)
ax.vlines(rayl.kwds['scale'], 0, rayl.pdf(rayl.kwds['scale']), linewidth=2, alpha=0.5)
ax.annotate("mode",
xy=(rayl.kwds['scale'], rayl.pdf(rayl.kwds['scale'])), xycoords='data',
xytext=(100, 50), textcoords='offset points',
va="bottom", ha="left",
arrowprops=dict(arrowstyle="->",
connectionstyle="arc3,rad=0.2",
mutation_scale=15,
linewidth=2,
edgecolor='black'
),
fontsize='large')
ax.vlines(rayl.median(), 0, rayl.pdf(rayl.median()), linewidth=2, alpha=0.5)
ax.annotate("median",
xy=(rayl.median(), rayl.pdf(rayl.median())), xycoords='data',
xytext=(100, 30), textcoords='offset points',
va="bottom", ha="left",
arrowprops=dict(arrowstyle="->",
connectionstyle="arc3,rad=0.2",
mutation_scale=15,
linewidth=2,
edgecolor='black'
),
fontsize='large')
ax.vlines(rayl.mean(), 0, rayl.pdf(rayl.mean()), linewidth=2, alpha=0.5)
ax.annotate(r"mean, $\bar{H}$",
xy=(rayl.mean(), rayl.pdf(rayl.mean())), xycoords='data',
xytext=(100, 10), textcoords='offset points',
va="bottom", ha="left",
arrowprops=dict(arrowstyle="->",
connectionstyle="arc3,rad=0.2",
mutation_scale=15,
linewidth=2,
edgecolor='black'
),
fontsize='large')
ax.vlines(rayl.ppf(5/6.0), 0, rayl.pdf(rayl.ppf(5/6.0)), linewidth=2, alpha=0.5)
ax.annotate("significant wave height, $H_{S}$",
xy=(rayl.ppf(5/6.0), rayl.pdf(rayl.ppf(5/6.0))), xycoords='data',
xytext=(100, 30), textcoords='offset points',
va="bottom", ha="left",
arrowprops=dict(arrowstyle="->",
connectionstyle="arc3,rad=0.2",
mutation_scale=15,
linewidth=2,
edgecolor='black'
),
fontsize='large')
ax.vlines(rayl.ppf(9/10.0), 0, rayl.pdf(rayl.ppf(9/10.0)), linewidth=2, alpha=0.5)
ax.annotate("90th percentile, $H_{1/10}$",
xy=(rayl.ppf(9/10.0), rayl.pdf(rayl.ppf(9/10.0))), xycoords='data',
xytext=(100, 30), textcoords='offset points',
va="bottom", ha="left",
arrowprops=dict(arrowstyle="->",
connectionstyle="arc3,rad=0.2",
mutation_scale=15,
linewidth=2,
edgecolor='black'
),
fontsize='large')
center = (maxx+rayl.ppf(2/3.0))/2.0+1
ax.text(center, 0.04, '1/3 of waves', ha='center', va='center', fontsize='large')
arrow = matplotlib.patches.FancyArrowPatch(
posA=(rayl.ppf(4/6.0), 0.04), posB=(center, 0.04), arrowstyle='<-',
mutation_scale=15.0, linewidth=2, edgecolor='black',
shrinkB=50
)
ax.add_patch(arrow)
arrow = matplotlib.patches.FancyArrowPatch(
posA=(center, 0.04), posB=(maxx, 0.04), arrowstyle='->',
mutation_scale=15.0, linewidth=2, edgecolor='black',
shrinkA=50
)
ax.add_patch(arrow)
ax.set_xlabel('wave height', size='x-large')
ax.set_xticks([])
ax.set_ylabel('number of waves',size='x-large')
ax.set_yticks([])
ax.set_title('Statistical wave distribution')
|
Licensing
This image is in the public domain because it contains materials that originally came from the U.S. National Oceanic and Atmospheric Administration, taken or made as part of an employee's official duties.
|
Original upload log
Transferred from en.wikipedia to Commons by SiggyF using CommonsHelper.
The original description page was here. All following user names refer to en.wikipedia.
- 2009-12-09 15:06 Hurricaneg 500×300× (10286 bytes) {{Information |Description = Wave Statistics |Source = NOAA UCAR COMET Program |Date = ~~~~~ |Author = COMET PROGRAM |Permission = Public |other_versions = n/a }}
File history
Click on a date/time to view the file as it appeared at that time.
| Date/Time | Thumbnail | Dimensions | User | Comment | |
|---|---|---|---|---|---|
| current | 23:15, 1 August 2012 | | 741 × 336 (19 KB) | wikimediacommons>SiggyF | {{Information |Description={{en|Wave Statistics}} |Source=Transferred from [http://en.wikipedia.org en.wikipedia]; transferred to Commons by User:SiggyF using [http://tools.wikimedia.de/~magnus/commonshelper.php CommonsHelper].<br/> Regenerated usi... |
File usage
The following page uses this file: