Electrocardiography
(Redirected from EKG)

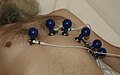
Electrocardiography (ECG/EKG) is the basic diagnostic method in cardiology. It monitors the heart's electrical activity (as an electrocardiogram) as measured from the surface of the body and allows its evaluation. ECG examinations are mostly non-invasive using electrodes placed on the skin. However it is also possible to measure the ECG from the esophagus wall or right on the heart's surface.
Since the electrical activity of the heart is very important for its mechanical activity, the ECG has an important diagnostic role in a number of heart diseases. In addition, we can detect disturbances arising from extra-cardiac causes (eg. thyroid dysfunction, ionic dysbalance). However, the ECG examination on it's own is not enough to produce a complete diagnosis.
Indications
ECG is indicated if there is suspicion onf
- heat disease: heart attack, arrhythmias, conduction disturbances, myocardial ischemia;
- metabolic disease: hypocalcemia or hypercalcemia, hypokalemia or hyperkalemia;
- endocrine disease: diseases of the thyroid gland (hypothyroidism and hyperthyroidism).
Principle

The myocardial potential spreads from the heart to the surface of the body as body tissues and fluids are good conductors of electricity.
W. Einthoven (1860-1927)
The capture of these potentials was introduced by the Dutch physiologist Willem Einthoven in the early 20th century. He used the three standard bipolar limb leads (I, II, III), still in use today, forming the so-called Einthoven triangle, in which the heart lies at the imaginary centroid. The principle of these leads is the connection of two active electrodes whose polarity is predetermined. The leads then record the potential difference between the electrodes and indicate the resulting amplitude. The vector sum of all three amplitudes of these limbs is equal to zero (Einthoven's law).
Today ECG measurement is improved by adding additional leads. They are called unipolar leads as the potential is always measured relative to a constant potential given by the average potential of the the RA, LA and LL potentials i.e., (RA + LA + LL)/3 called the Wilson potential), which is conventionally set as a reference zero potential. Thus, we obtain additional 'Goldberger augmented' limb leads (aVR, aVL, aVF) and the thoracic (V1-V6) leads. Therefore the most common ECG electrocardiagram has currently 12-leads. Under special circumstances, other leads may be used.
[[<iframe width="560" height="315" src="https://www.youtube.com/embed/xIZQRjkwV9Q" frameborder="0" allow="accelerometer; autoplay; encrypted-media; gyroscope; picture-in-picture" allowfullscreen></iframe>]]
ECG Leads
The 12 Conventional ECG Leads
Electrode


AVL

AVF


These 12 leads are divided into two groups:
- six extremity (limb) leads; they are recording electrical potentials transmitted into the frontal plane;
- six chest (precordial) leads, they are recording electrical potential transmitted into horizontal plane.[1]
There are the leads with their location and polarity[2]:
| limb | location of the lead | |||||
|---|---|---|---|---|---|---|
| bipolar extremity leads
-Einthoven's leads- | ||||||
| I | + | left upper limb | - | right upper limb |  | |
| II | left lower limb | right upper limb | ||||
| III | left lower limb | left upper limb | ||||
| unipolar extremity leads
-Goldberg's leads- | ||||||
| aVR | right upper limb lead | |||||
| aVL | left upper limb lead | |||||
| aVF | left lower limb lead | |||||
| unipolar chest leads
-Wilson's leads- |
V1 | fourth intercostal space, just to the right of the sternum |  | |||
| V2 | fourth intercostal space, just to the left of the sternum | |||||
| V3 | midway between V2 and V4, fifth intercostal space | |||||
| V4 | fifth intercostal space, midclavicular line on the left | |||||
| V5 | fifth intercostal space, anterior axillary line | |||||
| V6 | fifth intercostal space, midaxillary line | |||||
Additional ECG Leads
These leads are used in special situations, when conventional 12-leads ECG cannot reliably show the myocardial defect.[1]
Below are some examples of additional ECG leads[2]:
| lead | location of the lead | |||||
|---|---|---|---|---|---|---|
| unipolar chest leads | V7 | posterior axillary line, on the same level as V6, on the left |   | |||
| V8 | scapulary line, in the same level as V6, on the left | |||||
| V9 | paravertebral line on the left, on the same level as V6 | |||||
| VE | just to the left of processus xiphoideus | |||||
| V3R - V6R | on the right, same location as V3–V6 | |||||
| unipolar chest leads | V1´– V6´ | about 1 intercostal space above the V1–V6 | ||||
| V1´´– V6´´ | about 2 intercostal space above the V1–V6 | |||||
| esophageal leads | E/Oe | for example 37.5 cm (left atrium) | ||||
ECG curve
The spread of myocardial depolarization is different, depending on which lead is sensing the potential, that is, in which direction and in which plane it is located relative to the heart. The path of propagation of the potential from the heart has a typical character and produces typical waves, oscillations and lines that correspond to different phases of the cardiac cycle.

- P wave - depolarization and contraction of the atrium,
- PQ interval - depolarisation spreading from the atria to the ventricles,
- QRS complex - ventricular depolarization and contraction,
- Q = negative wave preceeding the R wave,
- R = any positive wave of the QRS complex,
- S = negative wave following the R wave,
- T wave - repolarization of the ventricles,
- U wave - not always seen, its origin is not completely clear.

The myocardial action potential normally arises from spontaneous depolarization in the sinoatrial node (SA), from where it spreads to the atrial muscles. The instantaneous final vector has a relatively small amplitude due to the thin wall of the atrium, and is pointing left down. In the ECG record it appears to be the P wave. Slow conduction in the atrioventricular node (AV) slows down the propagation of depolarization from the atria to the ventricles to separate the atrial systole from the ventricular systole. In the ECG graph it is visible as an isoelectric line (PR).
This is followed by depolarization of the ventricles, forming the QRS complex in the ECG record. The impulse progresses through the Hiss bundle and Tawar's arm to the muscles of the interventral septum, where depolarization spreads from left to right, thus the instantaneous vector directs right down. In the ECG is either a negative Q, or a positive R wave, depending on the lead. In the next step the excitation spreads to the heart apex, the instantaneous vector points to the left down direction, forming the central part of the QRS complex, in most leads it is the R wave. From there, depolarization spreads through the Purkyne fibers to the working myocardium of the two ventricles, from the endocard to the epicard. In the instantaneous vector the left ventricle's thick muscularity plays a role, so the vector points to the left. And in the end it points in the up and left direction when depolarizing the basal portion of the left ventricle, whilst completing the ventricular QRS complex.
After the depolarization is complete, the electrical heart activity is zero for a while, the muscular fibers are in the plateau phase, when no electrical currents flow through the myocardium. In the ECG record will be shown as an isoelectric line - ST segment. After this moment, ventricular repolarization begins, which goes backwards from the epicardium to the endocardium. Thus, a wave T is formed. Sometimes a U wave can be recorded on the ECG record, the origin of which is not known precisely, it is probably the manifestation of papillary muscles repolarization.

Electrocardiogram
The ECG is captured on millimeter paper. To correctly subtract the values, we must have:
- calibration pulse 1mV (corresponding to amplitude), usually = 10 mm,
- paper feed rate of either 50 mm / s (1 mm → 0.02 s) or 25 mm/s (1 mm → 0.04 s)

The ECG record evaluation consists of ten points:
- cardiac action
- heart rhythm
- heart rate
- wave P
- PQ interval
- QRS complex
- ST segment
- wave T
- QT interval
- axis of the heart

Evaluation of the electrocardiagram allows us to detect arrhythmias, as a sign of malfunctions of electric impluse creation or propagation. It also plays an important role in the detection of ischemic changes, localization and stage of myocardial infarction. Changes in the ECG are found either in all leads, or in just one, or the group of leads that are related to the particularl paart of the anatomy of the heart which is affected. For example the locus of myocardial infarction (IM) can be determined by the knowledge of its vascular supply and the projection of the heart sections on the surface of the body in a relation to the direction of recording of individual leads.
| Abnormalities localisation (IM) | Leads |
|---|---|
| lateral | I, aVL, V5, V6 |
| diaphragmatic (down) | II, III, aVF |
| anteroseptal | V1–V3 |
| whole anterior myocard | V1–V6 |
| antral | aVR |
Normal ECG

The electrocardiogram is graphic record of electrocardiography. ECG curve contains waves P, Q, R, S, T, and sometimes U. For description of ECG are very important intervals and segments between waves. Every ECG description has to start with description of heart rhythm (regularly or irregularly, sinus or nonsinus rhythm) and frequency.
Description of Waves, Intervals and Segments
P Wave
P wave should be always before QRS complex, separated by PQ interval. P wave is a sign of normal atrial depolarization.
Parameters:
- duration: 110 ms;
- amplitude: 0.25 mV;
- polarity:
- positive − always in leads I and II;
- negative − always in aVR lead.
When is P wave missing? Atrial flutter or fibrillation, …
PQ Interval
PQ interval is a period of atrial contraction. The depolarization is delayed in AV node.
Parameters:
- duration: 120−200 ms
- polarity: isoelectric
QRS Complex
QRS complex represents ventricular depolarization and contraction. There are two phases of ventricular depolarization:
- depolarization of interventricular septum − the vector is oriented from left to right and anteriorly;
- depolarization of ventricles − because the left ventricle is more massive than the right ventricle, the vector oriented from right to left and posteriorly[1].
There are three waveforms in QRS complex:
- Q wave − the first negative wave following P wave, may not always be presented;
- R wave − the first positive wave following P wave or Q wave;
- S wave − the first negative wave following R wave.
Parameters:
- duration of QRS complex: 100 ms or less;
- amplitude of Q wave;
- amplitude of R wave;
- amplitude of S wave.
ST Segment
ST segment is an isoelectric line, a time period with no electrical activity of the heart. Should be in the same level as PQ interval. Every elevation or depression of this line is pathological.
- Physiological duration is 320 ms.
T Wave
T wave represents repolarization of ventricles. The positivity or negativity should be the same as the major vector of the QRS complex.[1]
- Physiological duration 160 ms.
U Wave
The U wave is ordinarily small and follows T wave and usually has the same polarity as T wave.[1]
Heart Rhythm
Heart rhythm is physiologically generated by the SA node. Sign of its healthy functioning is P wave and PQ interval. Rhythm generated in SA node is called the sinus rhythm.
Heart Frequency
Heart frequency or heart rate is based on frequency of ventricular contraction. Can be easy measured from the ECG curve. It is necessary to compare two QRS complexes and measure the time interval between their R waves − RR interval (in seconds):

Normal heart rate is 55−90/min (varies in different books).
Links
Related Articles
References
- ↑ a b c d e KASPER, Dennis L – FAUCI, Anthony S – LONGO, Dan L, et al. Harrison's principles of Internal Medicine. 16th edition. New York : McGraw-Hill Companies, Inc, 2005. 2607 pp. pp. 1312-1313. ISBN 0-07-139140-1.
Cite error: Invalid
<ref>tag; name "Harrison" defined multiple times with different content - ↑ a b WikiSkripta. Elektrokardiografie [online]. ©2011. The last revision 2011-07-2, [cit. 2011-07-03]. <http://www.wikiskripta.eu/index.php/Elektrokardiografie>.
Bibliography
- KASPER, Dennis L – FAUCI, Anthony S – LONGO, Dan L, et al. Harrison's principles of Internal Medicine. 16th edition. New York : McGraw-Hill Companies, Inc, 2005. 2607 pp. pp. 1311-1319. ISBN 0-07-139140-1.